KEEPING UP WITH THE COAST: QUANTIFYING SHORELINE CHANGE ON HAWAI‘I ISLAND
Rose Hart, Ryan Perroy, Steven Colbert, Bethany Morrison, and Charles Fletcher III

Environment
Hāpuna State Beach Park (~10 ha), located on the northwest coast of Hawaiʻi Island, is the island’s largest and most popular white sandy beach for tourists and locals alike (Bode and Jol, 2006). This coastal setting is exposed to west and northwest swell and Kona storms that can generate moderately high waves of 3m - 6m, though waves are generally ~ 1m in height (Fletcher et al., 2002; Vitousek et al., 2009). However, if sea level rise and storm intensity increase as expected (i.e. Sweet et al., 2017), this treasured beach could be lost in the future.
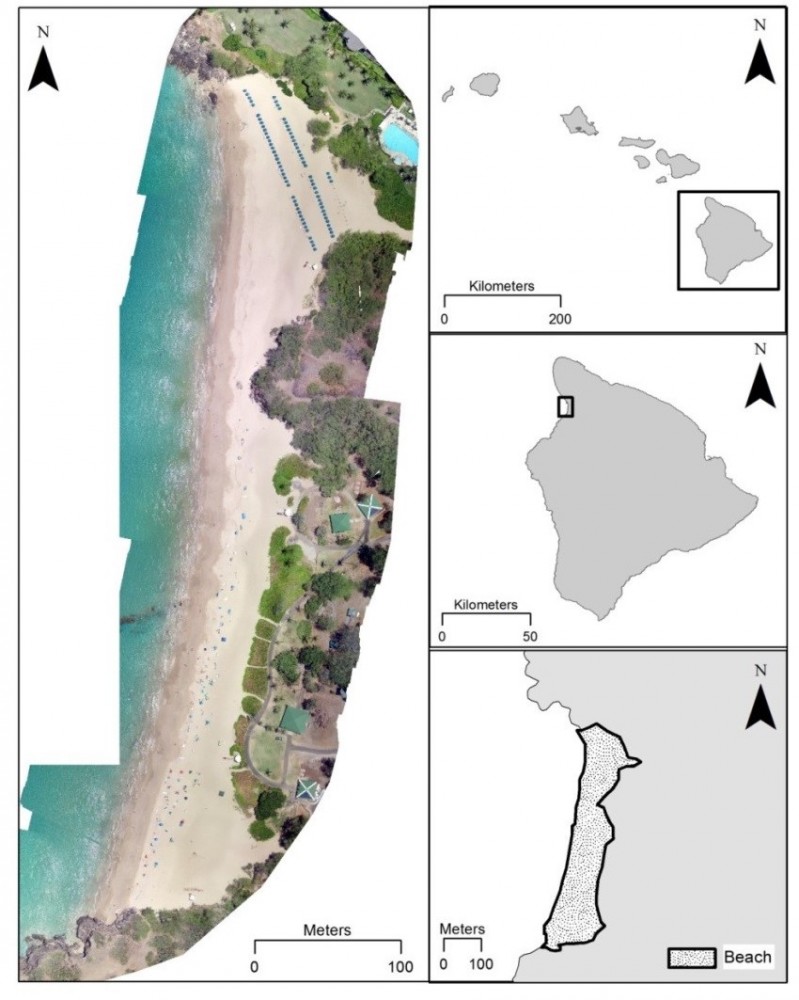
Figure 2. Map of Hāpuna State Beach Park. Left is a sUAS-derived orthophotomosaic of the site collected on 7/11/2017.
Methods
We quantified decadal and seasonal shoreline change rates at Hāpuna Beach via historic aerial imagery analysis and systematic small unmanned aerial system (sUAS) surveys conducted between January 2017 and January 2018. We delineated the shoreline position (i.e. the low water mark) along evenly spaced cast transects in GIS for all datasets and performed a linear regression using weighted least quares in the Digital Shoreline Analysis System (Fletcher et al., 2003; Thieler et al., 2017). We were also able to detect seasonal erosion and accresion by comparing Digital Elevation Models produced in Pix4D (Lausanne, Switzerland) and LasTools (Gilching, Germany).
Results
Our results reveal that Hāpuna Beach has undergone relatively small decadal-scale shoreline change ( -0.18 ± 0.17 m yr-1) between 1964 and 2018 (Figure 3), but experienced relatively large seasonal shoreline change (7.33 ± 2.29 m) and obvious beach morphology change between January 2017 and January 2018 (Figure 4).
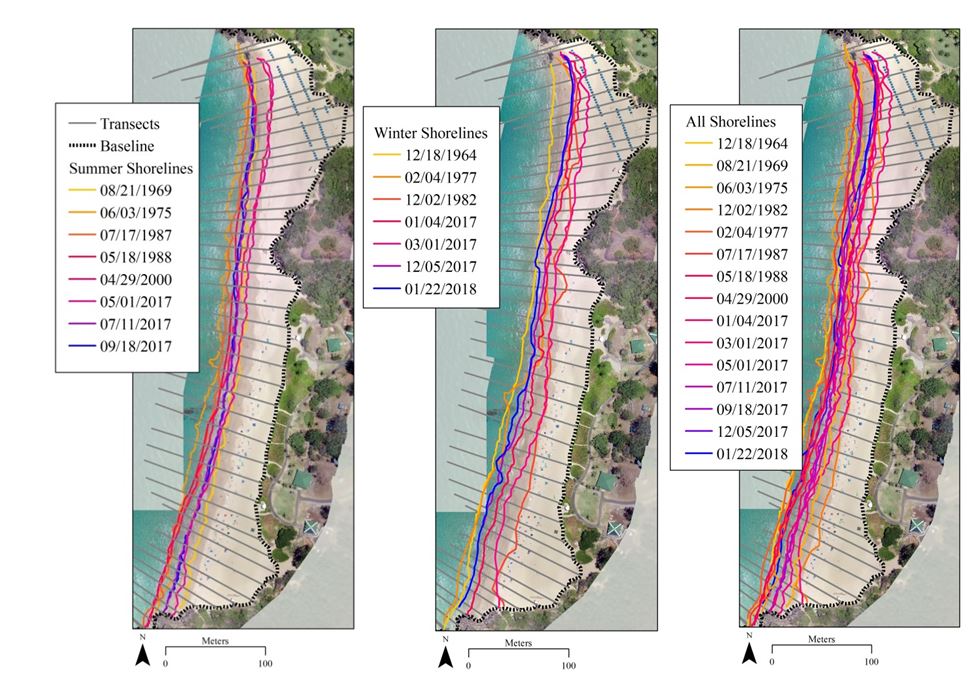
Figure 3. (Left) Summer shoreline Positions, (Middle) winter shoreline positions, and (Right) all shoreline positions.
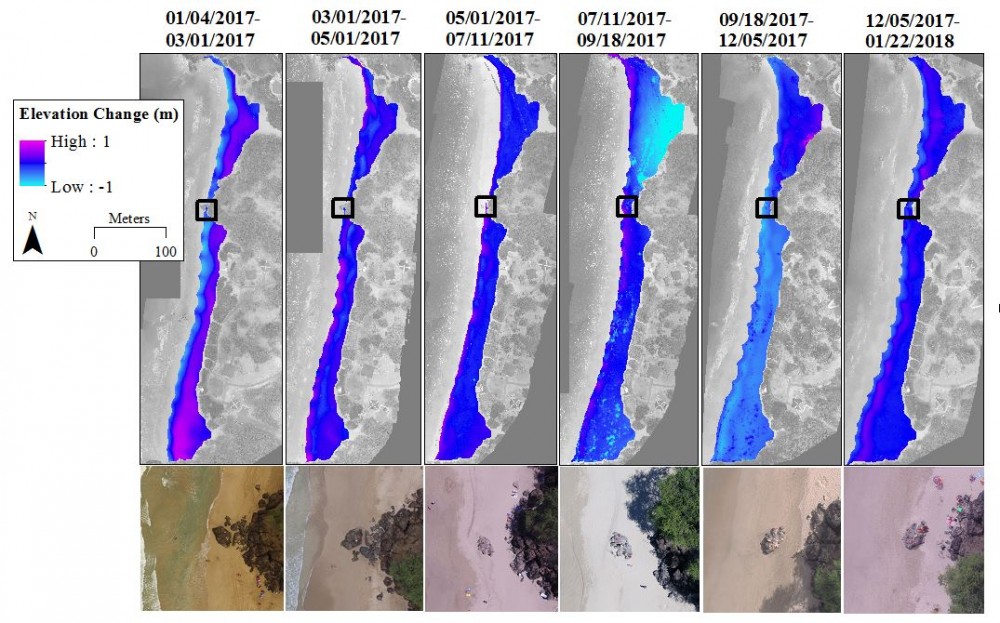
Figure 4. DEM maps highlighting beach sand erosion (bright blue) and accrual (bright pink). Below are images validating intra-annual changes via a rock outcrop by highlighting beach sand erosion and accretion.
We also produced a hydrostatic (bathtub) sea level rise model to estimate the impacts of 1 ft and 3 ft of sea level rise; we found that the present-day beach would be severely reduced, assuming that the beach is unable to migrate landward under sea level rise scenarios (Figure 5).
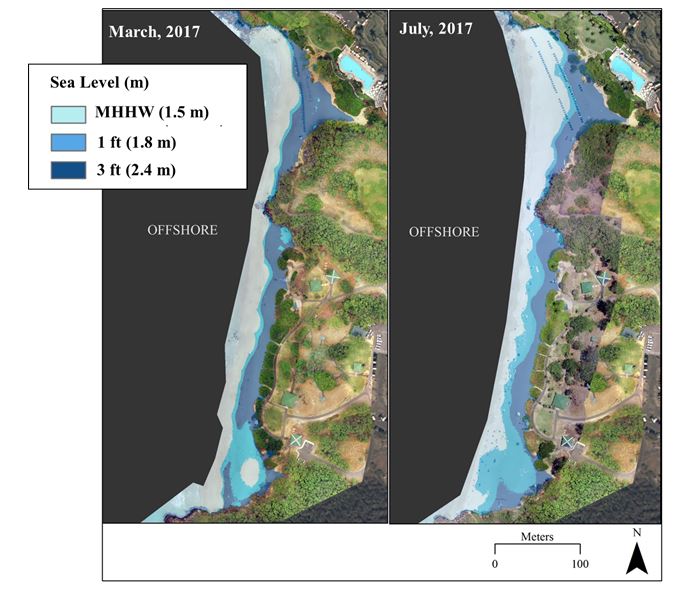
Figure 5. Potential SLR impacts at Hāpuna Beach under 2017 winter and summer beach morphology conditions.
Conclusions & Implications
Based on these results, we conclude that Hāpuna Beach is a highly dynamic beach that should be continuously monitored to better understand its vulnerabilities to sea level rise and coastal erosion. Hāpuna, and sandy beaches elesewhere, can be better protected from natural and anthropogenically influenced processes by applying calculated erosion rates to place-based shoreline setback policies, as implemented by Maui and Kauai Counties (Abbott, 2013).
HĀPUNA BEACH
Environment
Hāpuna State Beach Park (~10 ha), located on the northwest coast of Hawaiʻi Island, is the island’s largest and most popular white sandy beach for tourists and locals alike (Bode and Jol, 2006). This coastal setting is exposed to west and northwest swell and Kona storms that can generate moderately high waves of 3m - 6m, though waves are generally ~ 1m in height (Fletcher et al., 2002; Vitousek et al., 2009). However, if sea level rise and storm intensity increase as expected (i.e. Sweet et al., 2017), this treasured beach could be lost in the future.
Figure 2. Map of Hāpuna State Beach Park. Left is a sUAS-derived orthophotomosaic of the site collected on 7/11/2017.
Methods
We quantified decadal and seasonal shoreline change rates at Hāpuna Beach via historic aerial imagery analysis and systematic small unmanned aerial system (sUAS) surveys conducted between January 2017 and January 2018. We delineated the shoreline position (i.e. the low water mark) along evenly spaced cast transects in GIS for all datasets and performed a linear regression using weighted least quares in the Digital Shoreline Analysis System (Fletcher et al., 2003; Thieler et al., 2017). We were also able to detect seasonal erosion and accresion by comparing Digital Elevation Models produced in Pix4D (Lausanne, Switzerland) and LasTools (Gilching, Germany).
Results
Our results reveal that Hāpuna Beach has undergone relatively small decadal-scale shoreline change ( -0.18 ± 0.17 m yr-1) between 1964 and 2018 (Figure 3), but experienced relatively large seasonal shoreline change (7.33 ± 2.29 m) and obvious beach morphology change between January 2017 and January 2018 (Figure 4).
Figure 3. (Left) Summer shoreline Positions, (Middle) winter shoreline positions, and (Right) all shoreline positions.
Figure 4. DEM maps highlighting beach sand erosion (bright blue) and accrual (bright pink). Below are images validating intra-annual changes via a rock outcrop by highlighting beach sand erosion and accretion.
We also produced a hydrostatic (bathtub) sea level rise model to estimate the impacts of 1 ft and 3 ft of sea level rise; we found that the present-day beach would be severely reduced, assuming that the beach is unable to migrate landward under sea level rise scenarios (Figure 5).
Figure 5. Potential SLR impacts at Hāpuna Beach under 2017 winter and summer beach morphology conditions.
Conclusions & Implications
Based on these results, we conclude that Hāpuna Beach is a highly dynamic beach that should be continuously monitored to better understand its vulnerabilities to sea level rise and coastal erosion. Hāpuna, and sandy beaches elesewhere, can be better protected from natural and anthropogenically influenced processes by applying calculated erosion rates to place-based shoreline setback policies, as implemented by Maui and Kauai Counties (Abbott, 2013).
Environment
Honoliʻi Beach Park (~5 ha) is located on the east coast of Hawaiʻi Island and is characteristic of basalt sea cliffs with pebble beaches at the base of the cliffs (Fletcher et al., 2002). A statewide assessment of coastal hazard vulnerability ranked the steep cliffs adjacent to Honoli’i Cove as highly vulnerable to erosion, tsunamis, high waves, and storms (Fletcher et al., 2002). Our study site here is defined by a small stretch of cliff, where a property is actively succombing to severe cliff erosion and subsequent property damage (Figure 6).
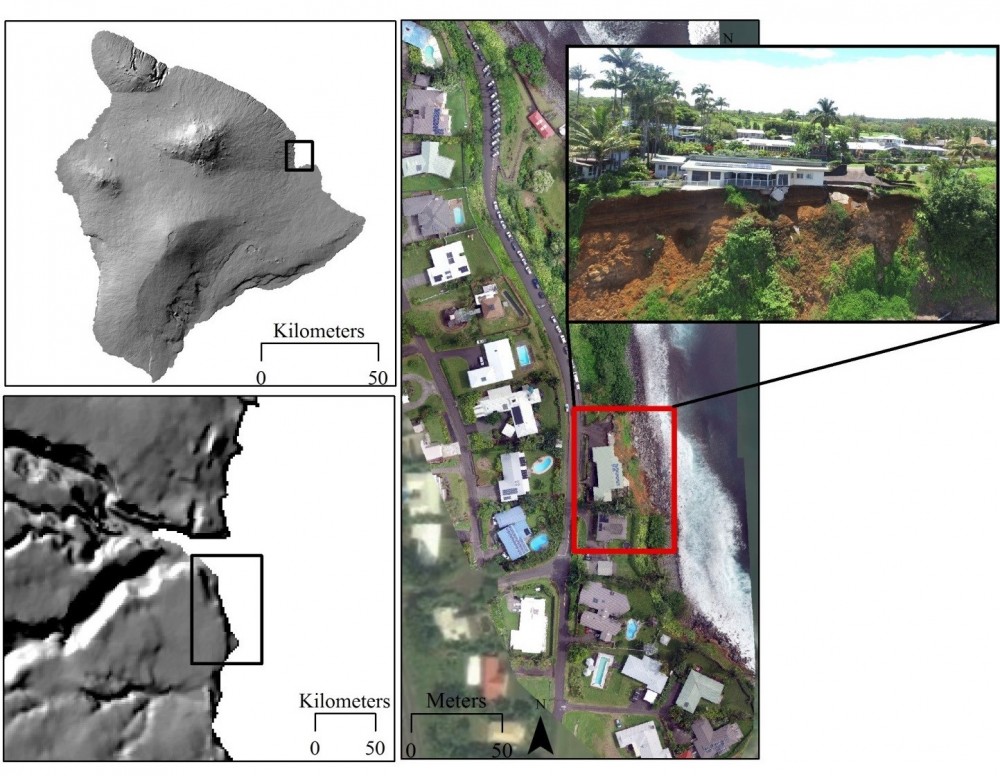
Figure 6. Map of the Honoli‘i study site.
Methods
We used a combination of 4 historic aerial photographs and sUAS derived orthophotomosaics and three-dimmensional datasets (e.g. the above video) to identify and determine a cliff edge shoreline. Using the Digital Shoreline Analysis System software, we computed long term and short-term, episodic cliff edge shoreline change rates for the study site (Hapke and Reid, 2007; Thieler et al., 2017).
Results
Our analyses of long-term cliff retreat at Honoli‘i finds that the top edge of the sea cliff has receded a maximum of 9.5 m in 54 years with an end point rate of -0.12 ± 0.01 m yr-1 (Figure 7). We also conducted a weighted least squares regression that similarly indicates the cliff has receded at a rate of -0.13 ± 0.26 m yr-1.
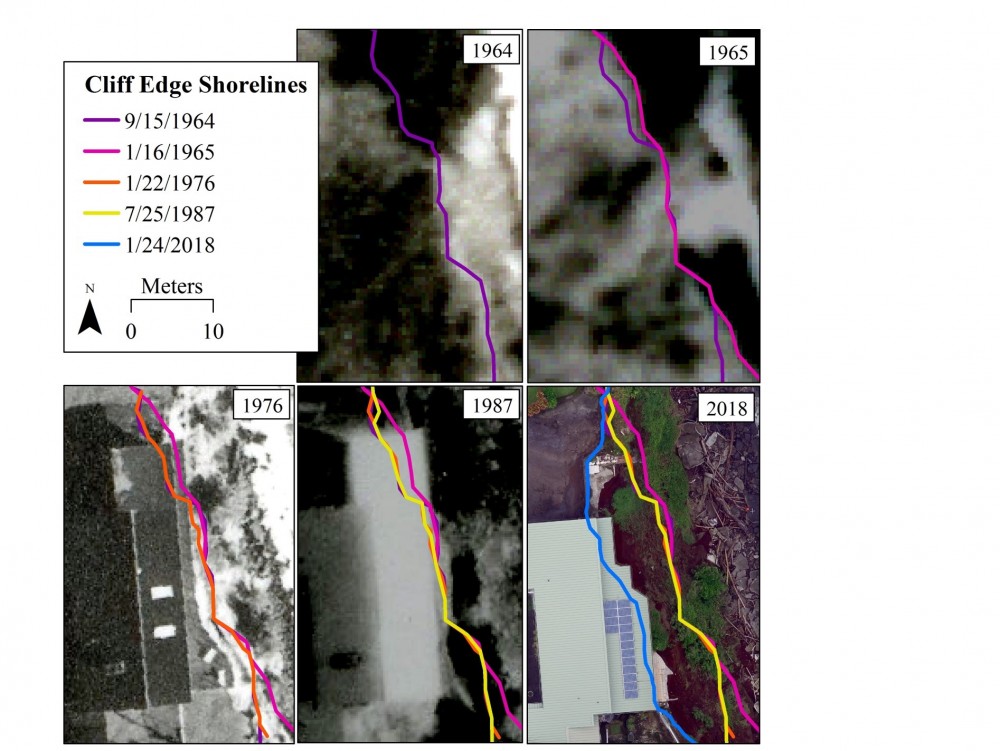
Figure 7. Visible cliff retreat between 1964 and 2018
Our short term shoreline change anylses found that the Honoli‘i sea cliff receded a maximum of 2.44 ± 0.02 m in one location between January 2017 and January 2018 (Figure 8). A total area of 34.5 m2 was eroded during the entire year of data collection.
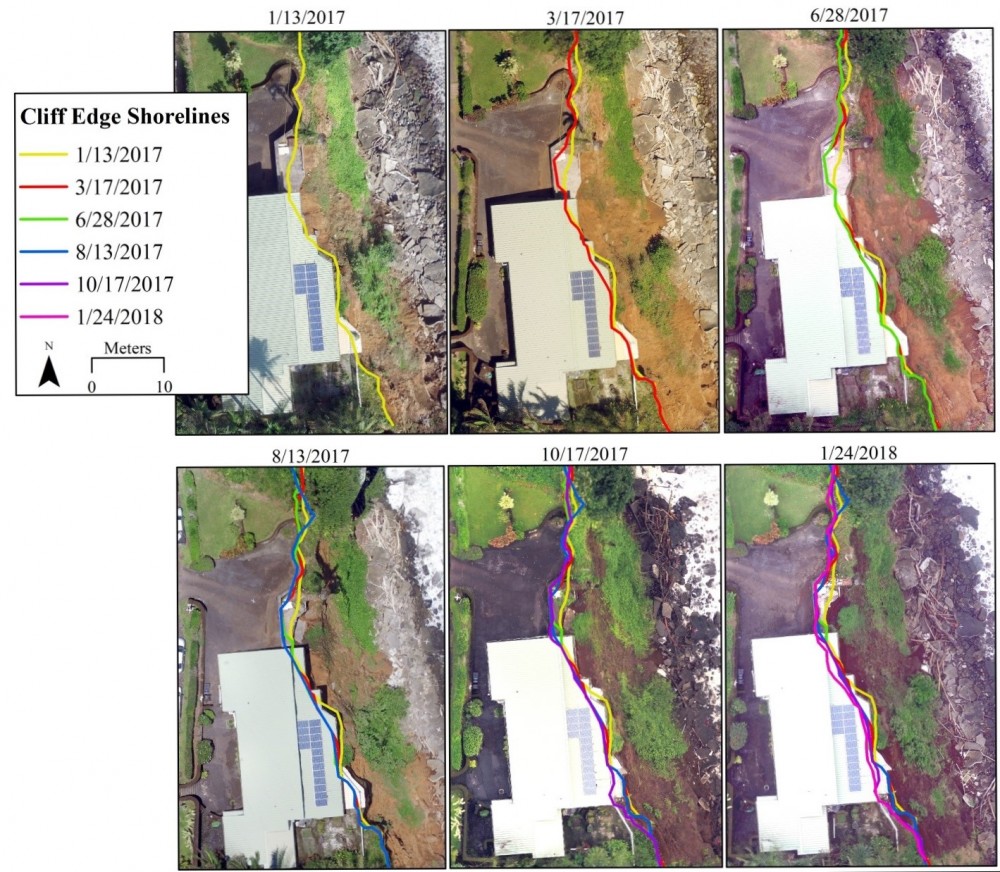
Figure 8. Subset of shoreline positions and associated orthophotomosaics at Honoli‘i between January 2017 and January 2018.
Conclusions & Implications
This study found that Honoliʻi has undergone long-term cliff reatreat since 1964, whith significant instances of episodic erosion. Our research Honoliʻi Beach Park informs the County of Hawai‘i, homeowners, and recreational users of cliff retreat hazards here, and what might be expected for other developed sea cliffs along Hawai‛i’s coast.
HONOLI῾I SEA CLIFF
Environment
Honoliʻi Beach Park (~5 ha) is located on the east coast of Hawaiʻi Island and is characteristic of basalt sea cliffs with pebble beaches at the base of the cliffs (Fletcher et al., 2002). A statewide assessment of coastal hazard vulnerability ranked the steep cliffs adjacent to Honoli’i Cove as highly vulnerable to erosion, tsunamis, high waves, and storms (Fletcher et al., 2002). Our study site here is defined by a small stretch of cliff, where a property is actively succombing to severe cliff erosion and subsequent property damage (Figure 6).
Figure 6. Map of the Honoli‘i study site.
Methods
We used a combination of 4 historic aerial photographs and sUAS derived orthophotomosaics and three-dimmensional datasets (e.g. the above video) to identify and determine a cliff edge shoreline. Using the Digital Shoreline Analysis System software, we computed long term and short-term, episodic cliff edge shoreline change rates for the study site (Hapke and Reid, 2007; Thieler et al., 2017).
Results
Our analyses of long-term cliff retreat at Honoli‘i finds that the top edge of the sea cliff has receded a maximum of 9.5 m in 54 years with an end point rate of -0.12 ± 0.01 m yr-1 (Figure 7). We also conducted a weighted least squares regression that similarly indicates the cliff has receded at a rate of -0.13 ± 0.26 m yr-1.
Figure 7. Visible cliff retreat between 1964 and 2018
Our short term shoreline change anylses found that the Honoli‘i sea cliff receded a maximum of 2.44 ± 0.02 m in one location between January 2017 and January 2018 (Figure 8). A total area of 34.5 m2 was eroded during the entire year of data collection.
Figure 8. Subset of shoreline positions and associated orthophotomosaics at Honoli‘i between January 2017 and January 2018.
Conclusions & Implications
This study found that Honoliʻi has undergone long-term cliff reatreat since 1964, whith significant instances of episodic erosion. Our research Honoliʻi Beach Park informs the County of Hawai‘i, homeowners, and recreational users of cliff retreat hazards here, and what might be expected for other developed sea cliffs along Hawai‛i’s coast.
Big Island, Big Stakes
Though bounded by nearly 430 km of ecologically, culturally, and economically important coastline, Hawai‘i Island has never had any systematic monitoring of long-term and short-term shoreline change rates to inform the county's shoreline setback policy. Consequently, occurances of unsustainable coastal development are impacted by compounded natural and anthropogenically influenced coastal processes such as erosion, subsidence, and sea level rise (SLR).
Our project goals were to:
- 1. Determine past long-term (decadal) rates of shoreline change using available historic aerial imagery datasets, based on existing published techniques (e.g. Fletcher et al., 2003; Hapke and Reid, 2007; Romine and Fletcher, 2013).
- 2. Determine contemporary short-term (monthly- yearly) shoreline change from repeated sUAS flight operations and total station surveys (e.g. Goncalves and Henriques, 2015; Habel et al., 2016).
- 3. Estimate future shoreline changes with combined SLR and place-based coastal change rates (e.g. Marrack, 2015).
- 4. Share these results with the County of Hawaiʻi and community members, and incorporate these results into setback regulations (e.g. Abbott, 2013).
We quantified shoreline change from the mid-twentieth century to the present for three diverse geomorphic coastal settings on Hawai‘i Island. These sites are a calcareous beach (Hāpuna State Beach Park), a sea cliff (Honoli‘i Beach Park), and a previously subsiding coastal lava field (Kapoho/Hawaiian Vacation Land- has since been consumed by ongoing lava flows in the lower East Rift Zone) (Figure 1).
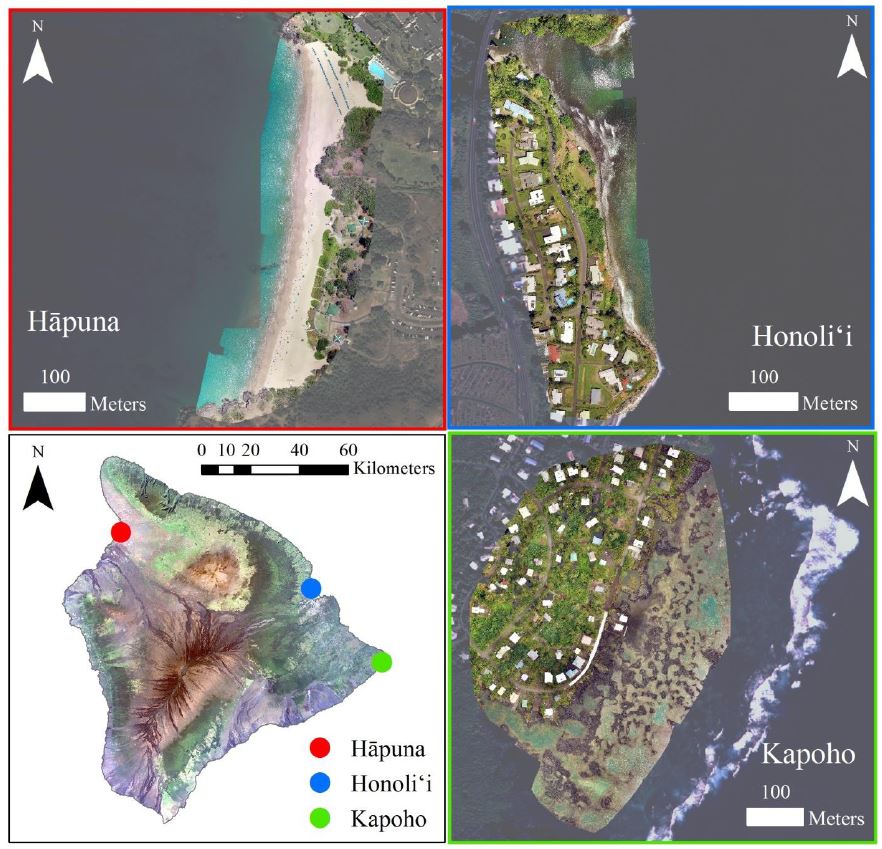
Figure 1. Three study sites included for this project.
PROJECT OVERVIEW
Big Island, Big Stakes
Though bounded by nearly 430 km of ecologically, culturally, and economically important coastline, Hawai‘i Island has never had any systematic monitoring of long-term and short-term shoreline change rates to inform the county's shoreline setback policy. Consequently, occurances of unsustainable coastal development are impacted by compounded natural and anthropogenically influenced coastal processes such as erosion, subsidence, and sea level rise (SLR).
Our project goals were to:
- 1. Determine past long-term (decadal) rates of shoreline change using available historic aerial imagery datasets, based on existing published techniques (e.g. Fletcher et al., 2003; Hapke and Reid, 2007; Romine and Fletcher, 2013).
- 2. Determine contemporary short-term (monthly- yearly) shoreline change from repeated sUAS flight operations and total station surveys (e.g. Goncalves and Henriques, 2015; Habel et al., 2016).
- 3. Estimate future shoreline changes with combined SLR and place-based coastal change rates (e.g. Marrack, 2015).
- 4. Share these results with the County of Hawaiʻi and community members, and incorporate these results into setback regulations (e.g. Abbott, 2013).
We quantified shoreline change from the mid-twentieth century to the present for three diverse geomorphic coastal settings on Hawai‘i Island. These sites are a calcareous beach (Hāpuna State Beach Park), a sea cliff (Honoli‘i Beach Park), and a previously subsiding coastal lava field (Kapoho/Hawaiian Vacation Land- has since been consumed by ongoing lava flows in the lower East Rift Zone) (Figure 1).
Figure 1. Three study sites included for this project.
Environment
Prior to recent volcanic events, Kapoho Vacation Estates (adjacent to the former Wai‘ōpae Tidepools Marine Life Conservation District) was a coastal community (~ 20 ha) on the south east coast of Hawai‛i Island that was actively subject to coastal hazards. Most of the Kapoho community was built atop low lying (<1.5 m elevation) lava fields and exposed to sea level rise and subsidence rates of 0.8-1.7 cm yr-1 and 0.7-1.6 cm yr-1, respectively.
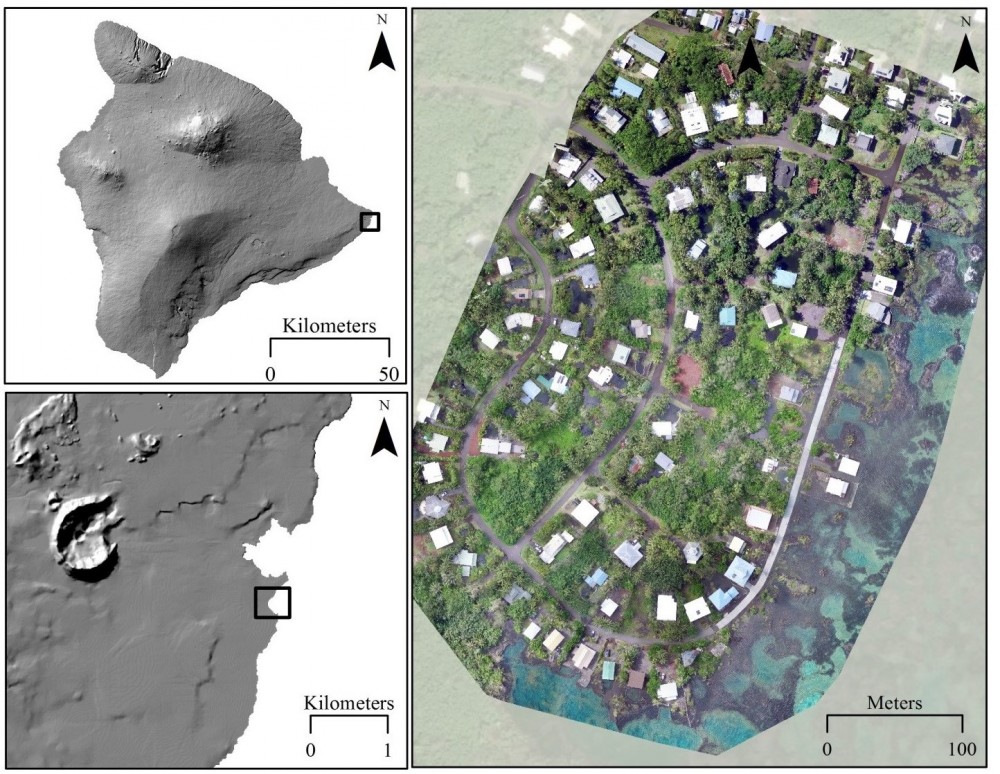
Figure 9. Map of the Kapoho study site.
This community also sustained a series of inland anchialine ponds, which had no surface connection to the ocean, but were tidally connected by groundwater; as the ocean tide rose, so did the water level in the anchialine ponds. Consequently, the Kapoho community was often subject to nuissance flooding during high tide, as seen in the video above. This study sought to quantify and estimate present-day and future coastal vulnerabilities to the Kapoho community, and provide recommendations for building coastal resiliency.
Methods
Present-day coastal vulnerabilities were determined by conducting one sUAS survey on October 8, 2017, during a low tide and on June 23, 2017, during an extreme high tide (i.e. king tide). Using those data, we identified existing anchialine ponds and delineated extreme flooding and pond overflow. Future caostal vulnerabilities were predicted by building a hydrostatic sea level rise model that combined sea level rise and subsidence rates estimated for this region (e.g. Hwang et al., 2007, Sweet et al., 2017).
Results
We estimated that 68% of total parcels/properties were impacted by the June 23, 2017 King Tide event, which caused inundation of 60 m greater than mean higher high tide water levels (Figure 10). We also estimated that 39 on-site waste disposal systems (OSWDS; i.e. cesspools and septic tanks) were flooded, which implied potentially hazardous nutrient input to the nearby Wai‘ōpae Tidepools (i.e. Wiegner et al., 2016)
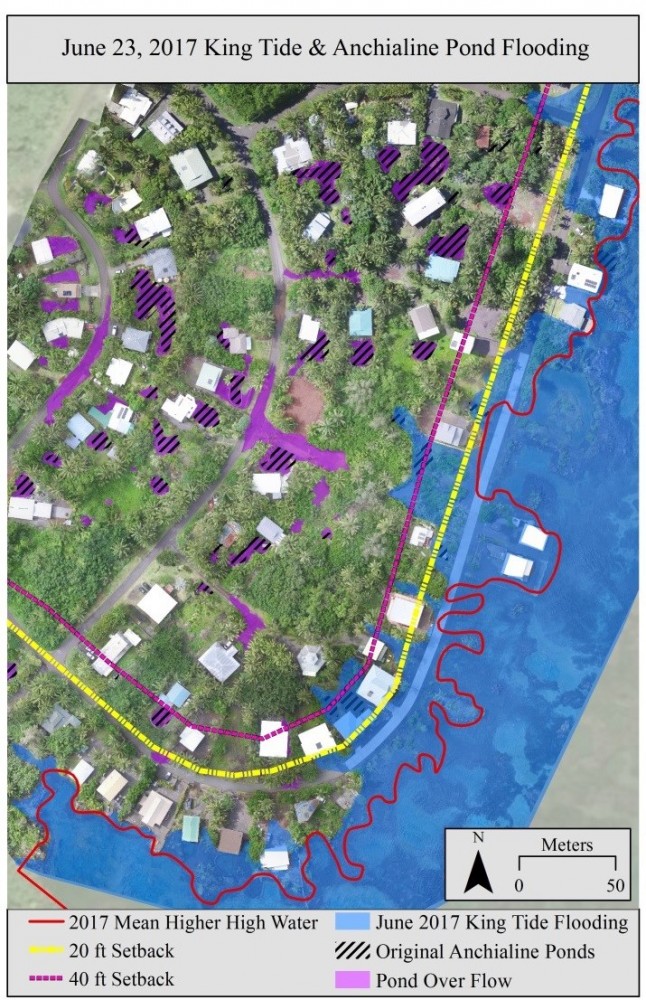
Figure 10. June 23, 2017 orthophotomosaic with anchialine pond over flow in dark purple, original anchialine pond boundaries in black dashes, extreme tide in dark blue, and MHHW delineated in red. The 20 ft and 40 ft setback are represented as the yellow and fuchsia dashed lines, respectively.
Using time scales of 10, 25, 50, and 75 years, we estimated that nearly all parcels/properties experience flooding in as early as 25 years, and within 75 years, all parcels and cesspools are affected by flooding (Figure 11).
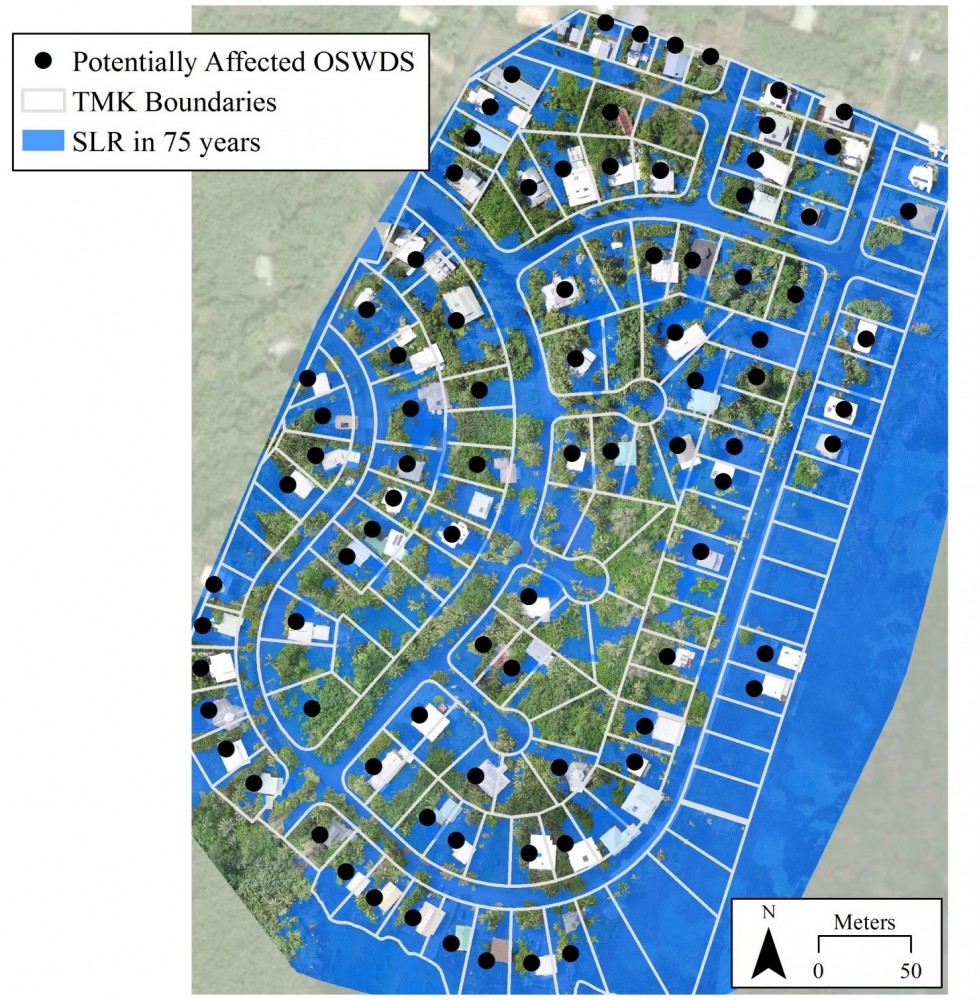
Figure 11. TMKs and onsite waste disposal systems impacted by SLR by 75 years.
Conclusions
Though recent lava flows destroyed Kapoho Vacation Estates and the adjacent Wai‘ōpae Tidepools on June 6, 2018, methodologies used to understand coastal vulnerabilities here can be applied to similar environments. High resolution sUAS surveys enable rapid and near real-time mapping of extreme tide events, which better informs how communties are impacted by such coastal hazards. Additionally, hydrostatic sea level rise modeling that considers local sea level rise rates and subsince rates (if applicable) can offer conservative, yet informative estimates of future flooding.
KAPOHO VACATION ESTATES
Environment
Prior to recent volcanic events, Kapoho Vacation Estates (adjacent to the former Wai‘ōpae Tidepools Marine Life Conservation District) was a coastal community (~ 20 ha) on the south east coast of Hawai‛i Island that was actively subject to coastal hazards. Most of the Kapoho community was built atop low lying (<1.5 m elevation) lava fields and exposed to sea level rise and subsidence rates of 0.8-1.7 cm yr-1 and 0.7-1.6 cm yr-1, respectively.
Figure 9. Map of the Kapoho study site.
This community also sustained a series of inland anchialine ponds, which had no surface connection to the ocean, but were tidally connected by groundwater; as the ocean tide rose, so did the water level in the anchialine ponds. Consequently, the Kapoho community was often subject to nuissance flooding during high tide, as seen in the video above. This study sought to quantify and estimate present-day and future coastal vulnerabilities to the Kapoho community, and provide recommendations for building coastal resiliency.
Methods
Present-day coastal vulnerabilities were determined by conducting one sUAS survey on October 8, 2017, during a low tide and on June 23, 2017, during an extreme high tide (i.e. king tide). Using those data, we identified existing anchialine ponds and delineated extreme flooding and pond overflow. Future caostal vulnerabilities were predicted by building a hydrostatic sea level rise model that combined sea level rise and subsidence rates estimated for this region (e.g. Hwang et al., 2007, Sweet et al., 2017).
Results
We estimated that 68% of total parcels/properties were impacted by the June 23, 2017 King Tide event, which caused inundation of 60 m greater than mean higher high tide water levels (Figure 10). We also estimated that 39 on-site waste disposal systems (OSWDS; i.e. cesspools and septic tanks) were flooded, which implied potentially hazardous nutrient input to the nearby Wai‘ōpae Tidepools (i.e. Wiegner et al., 2016)
Figure 10. June 23, 2017 orthophotomosaic with anchialine pond over flow in dark purple, original anchialine pond boundaries in black dashes, extreme tide in dark blue, and MHHW delineated in red. The 20 ft and 40 ft setback are represented as the yellow and fuchsia dashed lines, respectively.
Using time scales of 10, 25, 50, and 75 years, we estimated that nearly all parcels/properties experience flooding in as early as 25 years, and within 75 years, all parcels and cesspools are affected by flooding (Figure 11).
Figure 11. TMKs and onsite waste disposal systems impacted by SLR by 75 years.
Conclusions
Though recent lava flows destroyed Kapoho Vacation Estates and the adjacent Wai‘ōpae Tidepools on June 6, 2018, methodologies used to understand coastal vulnerabilities here can be applied to similar environments. High resolution sUAS surveys enable rapid and near real-time mapping of extreme tide events, which better informs how communties are impacted by such coastal hazards. Additionally, hydrostatic sea level rise modeling that considers local sea level rise rates and subsince rates (if applicable) can offer conservative, yet informative estimates of future flooding.
Our analyses using historic aerial imagery and sUAS-acquired imagery enabled us to produce the first dataset describing long- and short-term shoreline change rates specific to Hawai‘i Island’s diverse coast. Additionally, we applied sUAS to effectively monitor shoreline change on a temporal scale that has not been widely investigated. Our new understanding of past, present, and future changes at Hāpuna, Honoli‘i, and Kapoho has demonstrated that existing shoreline setbacks are not relevant across diverse geomorphic settings, and should be updated. Thus, we successfully produced data that can inform scientifically supported, place-based setbacks and other local coastal zone management strategies for Hawai‘i County planners.
Acknowledgements
We would like to gratefully acknowledge funding support and collaboration from the United States Geological Survey (USGS) via the Pacific Islands Climate Adaptation Science Center through Cooperative Agreement G12AC00003, without which this project would not be possible. We would also like to thank the Hawai‘i County Planning Department, Hawai‘i State Parks, Hāpuna Beach Prince Hotel, and the Honoli‘i and Kapoho residents for allowing us to work within their communities. Lastly, we would like to acknowledge additional funding sources from Hau‛oli Mau Loa Foundation for HCC conference travel.
