Two Years Down and Three Releases Later: Predator Control and Monitoring to Support the Reintroduction of the ‘Alalā (Corvus hawaiiensis)
L. Ku‘ulei Vickery (1), Jackie Gaudioso-Levita (1), T. Colleen Cole (2), Alex X. Wang (1), Steve Hess (3), Donna Ball (4), and Jay Nelson (4) 1. Pacific Cooperative Studies Unit, Honolulu, Hawai‘i, USA. 2. Three Mountain Alliance, Hawai'i Volcanoes National Park, Hawai‘i, USA. 3. U.S. Geological Survey, Hawai'i Volcanoes National Park, Hawai‘i, USA. 4. U.S. Fish and Wildlife Service, Honolulu, Hawai‘i, USA.

Released, conservation-bred ‘Alalā (Corvus hawaiiensis) in Puʻu Makaʻala Natural Area Reserve, on Hawaiʻi Island, benefit from the predator control program of the ‘Alalā Project by limiting predation and transmission of diseases. The predatory mammals present in this reserve include rats (Rattus rattus, R. norvegicus, and R. exulans), small Indian mongooses (Herpestes auropunctatus), and feral cats (Felis catus). Trap types for control of these mammals include conibear kill traps, live cage traps, and self-resetting Goodnature A24 traps which have a custom excluder to prevent non-target captures, including ‘Alalā. Since 2016, 200 rats, 105 mongooses, and 13 cats were removed from the ‘Alalā release area. Rodents were monitored using tracking tunnels with ink cards, and cats were monitored using trail cameras. The first release site showed a 73% decrease (71% to 19%) overall of rodents in the treatment area during one year of monitoring. The second release site showed a 3% increase (31% to 32%) in treatment and a 25% increase (20% to 25%) in control overall, although there were fluctuations throughout the one year of monitoring. The third release site has shown a 41% decrease (97% to 64%) and 36% decrease (76% to 53%) of rats in treatment and control, respectively, between baseline and first run. Cat detections from trail cameras show a regular use of the landscape with highest activity between 5pm and 9pm. Samples from 31 rats (tissue) and 11 cats (blood) have been taken for molecular diagnostics of Toxoplasma gondii. Predator control and monitoring will continue throughout future ‘Alalā releases to minimize predation and disease threats to the species.
- Release Site 1 rodent grid captures declined after Goodnature excluders were added in early November 2016.
- Captures fluctuated over time. There are no clear patterns given the low capture rates, the variety of trap types, and different installation dates of grids/trap lines.
- Cat captures averaged one per month from August 2016 to April 2017.
Cat detections
- There are more detections from the South. The South had more cameras and for a longer period than the North.
- The South has more human activity nearby, with potential ingress from the prison, roads, and fencelines. The North extent of the reserve is bordered by the 1942 ‘a’a lava flow and is at higher elevation, making it marginal habitat for cats.
- We will continue to cat trap in both sections to reduce ingress, protect release sites and birds in flight aviary, and to account for large home ranges of cats.
Rodent Monitoring
Release Site 1
- Rodent grid removal in March 2017 showed a lingering impact, 6 months after it was removed. The “control” rat tracking stayed relatively the same.
Release Site 2
- Rat tracking did not significantly decrease. The “treatment” rat tracking was typically higher than the “control” rat tracking, with the “control” staying within the 20% range.
- Predator control in conjunction with a reintroduction is a situation where supplemental food can attract rodents.
- We will implement a new Goodnature A24 excluder design which should be more accessible for rodents to access trap chamber.
Release Site 3
- There was a decrease of rat tracking for both “treatment” and “control” after baseline and three months of trapping but a longer term data set is needed to establish trends.
- We will also implement the new Goodnature A24 excluder design to Release Site 3.
The ‘Alalā (Hawaiian Crow, Corvus hawaiiensis), endemic to Hawai`i and once common in mesic forests of Southern and leeward Hawai`i Island, have been extinct in the wild since 2002, up until current reintroduction efforts started in 2016. To date, there have been two ‘Alalā releases in the Pu‘u Maka‘ala Natural Area Reserve, one in December 2016 and another in September-October 2017; the next release is scheduled for Fall 2018. The reserve occupies 7,570 hectares in the Puna and South Hilo districts on Mauna Loa, within the Kūlani area, on the island of Hawai‘i and will be the location of 'Alalā releases for the next 2-4 years (Figure 1). The threats that led to the extinction of this species in the wild likely include a combination of habitat loss and degradation, predation by introduced mammals, and introduced diseases such as Toxoplasma gondii. The adaptive management strategy of this project has allowed for changes in trapping methodology to reflect needs of released birds and reduce non-target effects of the trapping program.
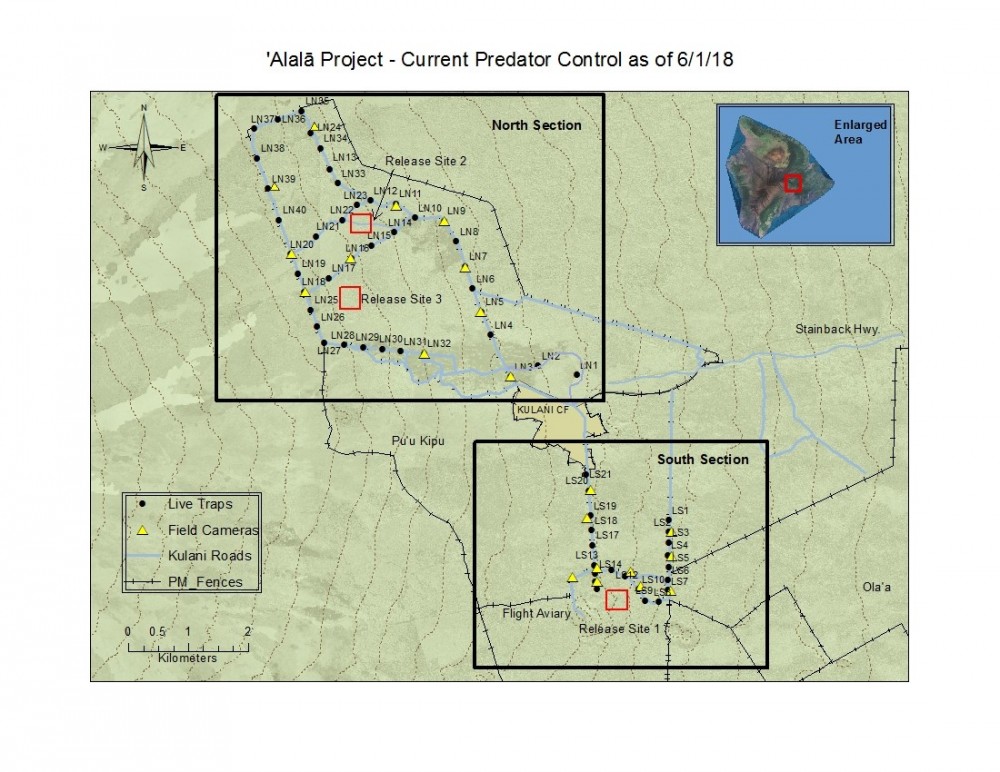
Figure 1. Current predator control trapping at Pu'u Maka'ala Natural Area Reserve with Northern and Southern sections, traps, and release sites labelled.
Rats and mongoose are known to depredate on bird eggs, nestlings, and fledglings and may be intermediate hosts of the parasite, T. gondii, which is known to cause fatal infection in ‘Alalā (Dubey and Beattie, 1988; Work 2000). There is potential for ‘Alalā to become infected if they consume infected animals. (Hutchinson et al. 1969). Feral cats are likely the most significant threat to ‘Alalā, through their demonstrated depredation of Hawaiian avifauna at various stages of development (Hess et al. 2004; Hess 2011), as well as their role as the definitive host for T. gondii (Wallace et al. 1972). These predators may also compete with ‘Alalā for food resources in their shared habitat.
The conservation goals of this predator control program are to:
• Reduce predation of ‘Alalā by introduced mammals
• Reduce the risk of ‘Alalā mortality due to T. gondii
• Reduce rodent presence at feeding stations in the ‘Alalā flight conditioning aviary, release aviaries, or at supplementary feeding stations
• Implement the control program such that the non-target effects of the control do not negatively affect ‘Alalā (Gaudioso-Levita et al. 2017; VanderWerf et al. 2013)
Introduction
The ‘Alalā (Hawaiian Crow, Corvus hawaiiensis), endemic to Hawai`i and once common in mesic forests of Southern and leeward Hawai`i Island, have been extinct in the wild since 2002, up until current reintroduction efforts started in 2016. To date, there have been two ‘Alalā releases in the Pu‘u Maka‘ala Natural Area Reserve, one in December 2016 and another in September-October 2017; the next release is scheduled for Fall 2018. The reserve occupies 7,570 hectares in the Puna and South Hilo districts on Mauna Loa, within the Kūlani area, on the island of Hawai‘i and will be the location of 'Alalā releases for the next 2-4 years (Figure 1). The threats that led to the extinction of this species in the wild likely include a combination of habitat loss and degradation, predation by introduced mammals, and introduced diseases such as Toxoplasma gondii. The adaptive management strategy of this project has allowed for changes in trapping methodology to reflect needs of released birds and reduce non-target effects of the trapping program.
Figure 1. Current predator control trapping at Pu'u Maka'ala Natural Area Reserve with Northern and Southern sections, traps, and release sites labelled.
Rats and mongoose are known to depredate on bird eggs, nestlings, and fledglings and may be intermediate hosts of the parasite, T. gondii, which is known to cause fatal infection in ‘Alalā (Dubey and Beattie, 1988; Work 2000). There is potential for ‘Alalā to become infected if they consume infected animals. (Hutchinson et al. 1969). Feral cats are likely the most significant threat to ‘Alalā, through their demonstrated depredation of Hawaiian avifauna at various stages of development (Hess et al. 2004; Hess 2011), as well as their role as the definitive host for T. gondii (Wallace et al. 1972). These predators may also compete with ‘Alalā for food resources in their shared habitat.
The conservation goals of this predator control program are to:
• Reduce predation of ‘Alalā by introduced mammals
• Reduce the risk of ‘Alalā mortality due to T. gondii
• Reduce rodent presence at feeding stations in the ‘Alalā flight conditioning aviary, release aviaries, or at supplementary feeding stations
• Implement the control program such that the non-target effects of the control do not negatively affect ‘Alalā (Gaudioso-Levita et al. 2017; VanderWerf et al. 2013)
Trapping
Trapping started approx. 4 months prior to the 2016 ‘Alalā release and has continued year-round. Traps were placed on the landscape in grids, along 4x4 roads, or fence lines in the Northern and Southern sections of the Pu’u Maka’ala NAR (Figure 1). Trap types include Victor rat snap traps, Goodnature A24 traps, conibear #160 kill traps, and live cat cage traps (Tomahawk or Havahart brand) (see Figures 2-5 and Table 1). Trap lures varied and included: peanut butter, Goodnature rat lure (Long Life Chocolate Formula), a 1 x 1-inch square sponge soaked in fish oils with petroleum jelly based fish paste, dry cat food mixed with fish oils, wet canned cat food, sardines, and Cat Passion Lure. Due to the adaptive management approach to predator control, trap lines and methods differed in spacing and mounting height pre-and post-December 2016 ‘Alalā release and have changed for subsequent releases, based on staffing resources and release activities across the landscape. During the interim between release one and two when no birds were on the landscape, conibears were set on the ground. Conibears were completely removed in April 2018 due to changing ‘Alalā behavior and expanding live trapping around the perimeter of the Northern section.
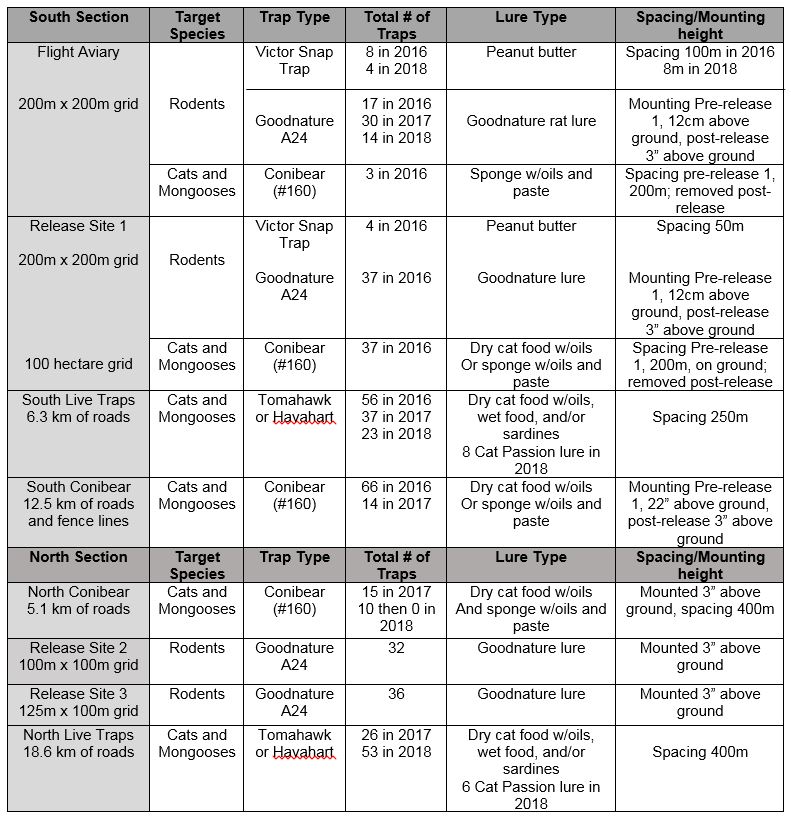
Table 1. Trapping methods used in 2016 - 2018 by section of the NAR and site area.
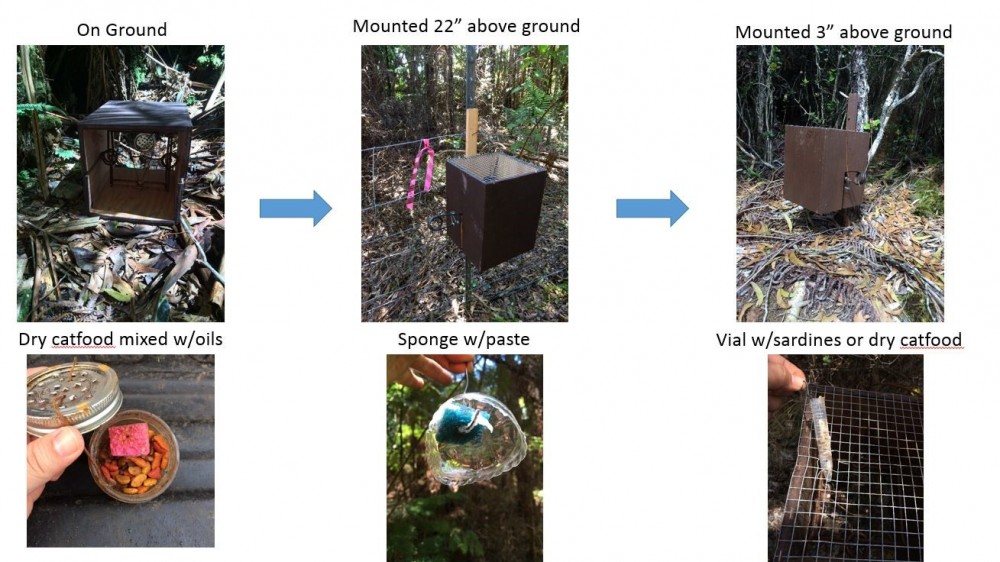 Figure 2. Changes to conibear methods over time and 'alalā releases. From left to right: conibear on ground in forest grid pre-2016 release, conibear mounted 22” above ground on fencelines pre-2016 release, conibear mounted 3” above ground post-2016 release.
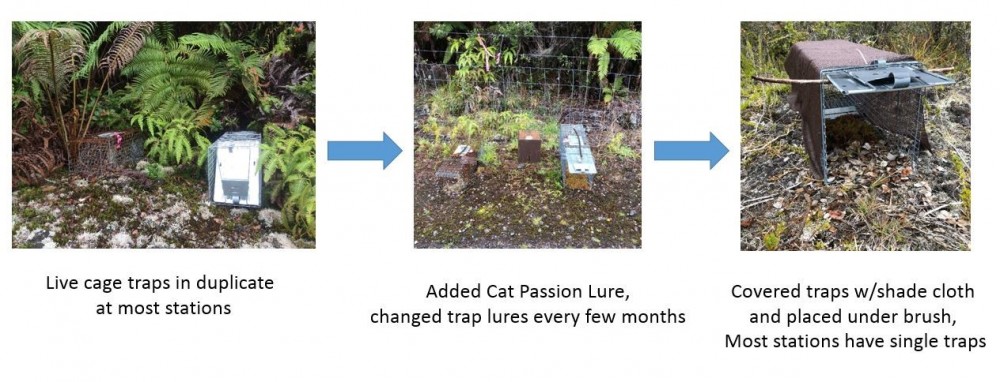 Figure 3. Changes to live cage trap methods over time. From left to right: Live cage traps set in duplicate at 26 stations in Northern and Southern sections for pre- and post-2016 release; traps baited with fresh lure weekly with rotating lure every few months, added Cat Passion lure in 2018; expanded live cage trapping in the North pre-2018 release although most stations have a single trap (37 single stations in North and South), added shade cloth and tucked under brush to camouflage traps.
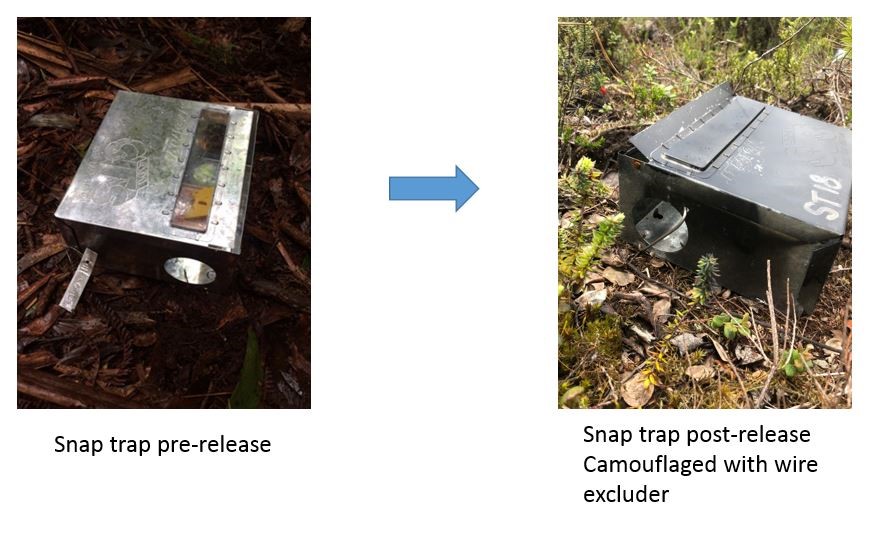 Figure 4. Changes to snap traps pre- and post-release. From left to right: metal boxes house Victor rat snap traps; boxes were camouflaged with paint and a 10 gauge wire was added to opening on each side to further exclude non-target animals post-release.
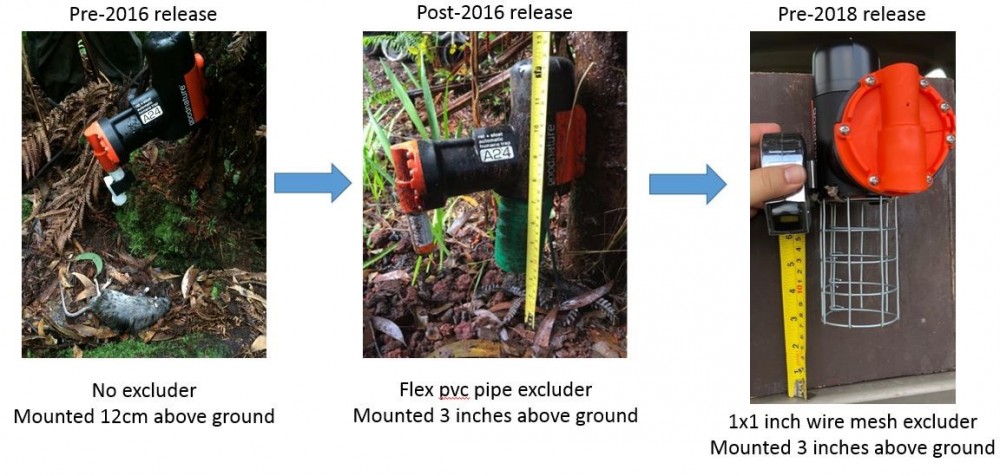 Figure 5. Changes to Goodnature A24 over time. From left to right: Pre-2016 no excluder, trap mounted the manufacturer recommended 12 cm above ground ; custom 4 inch flex pvc pipe excluder added to bottom opening of Goodnature A24, mounted 3 inches above ground to prevent non-target effects on ‘Alala; custom 1 x 1-inch wire mesh tube added to bottom opening of Goodnature A24, mounted 3 inches above ground.
Monitoring
Monitoring of rodents was conducted on 500-meter long transects (with Release Site 3 being 550-meters long), 50 - 200 meters apart for Release Sites. Tracking tunnels were placed every 50-meters for Release Sites 1 and 2, and every 35-meters in treatment area with 50-meter spacing in control area for Release Site 3. All tracking tunnels were pre-baited one week prior to first run/activation (see Figure 6). The control tunnels are in locations at least 50-meters from rodent traps, and the treatment tunnels overlapped with the rodent control grid. The flight aviary has a modified monitoring grid of 25-meter spacing within the treatment area due to the small rodent grid scale, with 50-meter spacing of control tunnels (see Table 2). Tracking tunnels were run before trapping began (baseline), and are run every 3 months thereafter (see Gillies and Williams, 2013). Note that the rodent grid at Release Site 1 was removed in mid-February 2017 but monitoring continued for an additional six months.
![]()
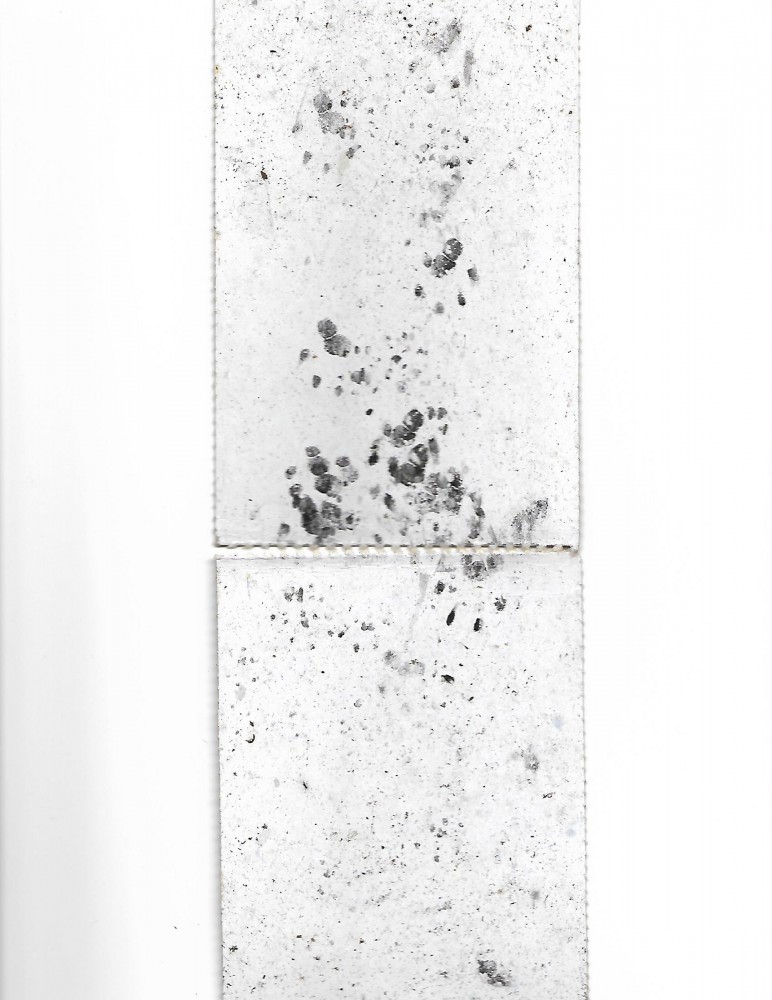
Figure 6. Tracking tunnel with example ink card below.
|
Rodent Monitoring Area |
# of Treatment Tunnels |
# of Control Tunnels |
Total # of Tracking Tunnels |
|
Flight Aviary |
10 |
10 |
20 |
|
Release Site 1
|
19 |
51 |
70
|
|
Release Site 2 |
16 |
14 |
30 |
|
Release Site 3 |
15 |
21 |
36 |
Table 2. Rodent monitoring tracking tunnels by site, as of June 2018.
Monitoring of cats was conducted using motion-sensor trail cameras (see Figure 7), which were placed facing conibear traps, live cage traps, or on trails first using random spacing (Release Site 1 in 2016), then using standardized spacing at about every other live cat trap (2017 and 2018) (see Table 3; Rowcliffe et al. 2008; Glen et al. 2013). Semi-standardized spacing of cameras for release site 2 in 2017 consisted of five cameras spaced at every other live cat trap on the main road leading to the site. In 2018, the camera monitoring area expanded across the landscape in the Northern section of the NAR but were not spaced as closely (see Figure 1). Memory cards from the cameras are switched and reviewed every 2-3 weeks.
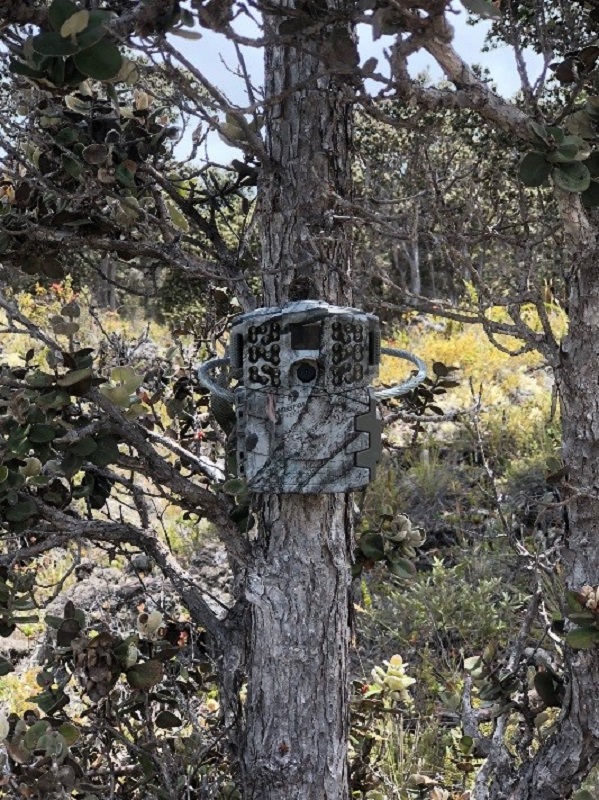
Figure 7. Trail camera Moultrie M-999i
|
Cat Monitoring Area |
# of camera traps |
Spacing of cameras |
|
Release Site 1 (South) |
10 for 2016-2018
|
2016 random 2017-2018 every 400m |
|
Release Site 2 Release Site 3 (North) |
5 in 2017 11 in 2018 |
2018 every 800m-2km |
Table 3. Cat monitoring cameras and spacing.
Statistical analysis
Animal captures are shown in a categorical line graph (see Figure 8). Capture rates for each trapping type used were calculated as: ((total # captures/ # trap nights) x 100), and this was calculated for each year of the project (see Table 4). Cat detections are shown by line graphs and spatial maps (Figures 12-15).
Rat tracking was calculated by reading ink cards, and for additional rodent monitoring analysis, we conducted Pearson chi-square tests or Fisher's Exact Tests (when frequency <5) to compare the frequency of cards with and without tracks for rats for tracking tunnels (Figures 9-11). We conducted two-sample t-tests to compare the cat detection rates in North vs. South.
Methods
Trapping
Trapping started approx. 4 months prior to the 2016 ‘Alalā release and has continued year-round. Traps were placed on the landscape in grids, along 4x4 roads, or fence lines in the Northern and Southern sections of the Pu’u Maka’ala NAR (Figure 1). Trap types include Victor rat snap traps, Goodnature A24 traps, conibear #160 kill traps, and live cat cage traps (Tomahawk or Havahart brand) (see Figures 2-5 and Table 1). Trap lures varied and included: peanut butter, Goodnature rat lure (Long Life Chocolate Formula), a 1 x 1-inch square sponge soaked in fish oils with petroleum jelly based fish paste, dry cat food mixed with fish oils, wet canned cat food, sardines, and Cat Passion Lure. Due to the adaptive management approach to predator control, trap lines and methods differed in spacing and mounting height pre-and post-December 2016 ‘Alalā release and have changed for subsequent releases, based on staffing resources and release activities across the landscape. During the interim between release one and two when no birds were on the landscape, conibears were set on the ground. Conibears were completely removed in April 2018 due to changing ‘Alalā behavior and expanding live trapping around the perimeter of the Northern section.
Table 1. Trapping methods used in 2016 - 2018 by section of the NAR and site area.
Figure 2. Changes to conibear methods over time and 'alalā releases. From left to right: conibear on ground in forest grid pre-2016 release, conibear mounted 22” above ground on fencelines pre-2016 release, conibear mounted 3” above ground post-2016 release.
Figure 3. Changes to live cage trap methods over time. From left to right: Live cage traps set in duplicate at 26 stations in Northern and Southern sections for pre- and post-2016 release; traps baited with fresh lure weekly with rotating lure every few months, added Cat Passion lure in 2018; expanded live cage trapping in the North pre-2018 release although most stations have a single trap (37 single stations in North and South), added shade cloth and tucked under brush to camouflage traps.
Figure 4. Changes to snap traps pre- and post-release. From left to right: metal boxes house Victor rat snap traps; boxes were camouflaged with paint and a 10 gauge wire was added to opening on each side to further exclude non-target animals post-release.
Figure 5. Changes to Goodnature A24 over time. From left to right: Pre-2016 no excluder, trap mounted the manufacturer recommended 12 cm above ground ; custom 4 inch flex pvc pipe excluder added to bottom opening of Goodnature A24, mounted 3 inches above ground to prevent non-target effects on ‘Alala; custom 1 x 1-inch wire mesh tube added to bottom opening of Goodnature A24, mounted 3 inches above ground.
Monitoring
Monitoring of rodents was conducted on 500-meter long transects (with Release Site 3 being 550-meters long), 50 - 200 meters apart for Release Sites. Tracking tunnels were placed every 50-meters for Release Sites 1 and 2, and every 35-meters in treatment area with 50-meter spacing in control area for Release Site 3. All tracking tunnels were pre-baited one week prior to first run/activation (see Figure 6). The control tunnels are in locations at least 50-meters from rodent traps, and the treatment tunnels overlapped with the rodent control grid. The flight aviary has a modified monitoring grid of 25-meter spacing within the treatment area due to the small rodent grid scale, with 50-meter spacing of control tunnels (see Table 2). Tracking tunnels were run before trapping began (baseline), and are run every 3 months thereafter (see Gillies and Williams, 2013). Note that the rodent grid at Release Site 1 was removed in mid-February 2017 but monitoring continued for an additional six months.
![]()
Figure 6. Tracking tunnel with example ink card below.
|
Rodent Monitoring Area |
# of Treatment Tunnels |
# of Control Tunnels |
Total # of Tracking Tunnels |
|
Flight Aviary |
10 |
10 |
20 |
|
Release Site 1
|
19 |
51 |
70
|
|
Release Site 2 |
16 |
14 |
30 |
|
Release Site 3 |
15 |
21 |
36 |
Table 2. Rodent monitoring tracking tunnels by site, as of June 2018.
Monitoring of cats was conducted using motion-sensor trail cameras (see Figure 7), which were placed facing conibear traps, live cage traps, or on trails first using random spacing (Release Site 1 in 2016), then using standardized spacing at about every other live cat trap (2017 and 2018) (see Table 3; Rowcliffe et al. 2008; Glen et al. 2013). Semi-standardized spacing of cameras for release site 2 in 2017 consisted of five cameras spaced at every other live cat trap on the main road leading to the site. In 2018, the camera monitoring area expanded across the landscape in the Northern section of the NAR but were not spaced as closely (see Figure 1). Memory cards from the cameras are switched and reviewed every 2-3 weeks.
Figure 7. Trail camera Moultrie M-999i
|
Cat Monitoring Area |
# of camera traps |
Spacing of cameras |
|
Release Site 1 (South) |
10 for 2016-2018
|
2016 random 2017-2018 every 400m |
|
Release Site 2 Release Site 3 (North) |
5 in 2017 11 in 2018 |
2018 every 800m-2km |
Table 3. Cat monitoring cameras and spacing.
Statistical analysis
Animal captures are shown in a categorical line graph (see Figure 8). Capture rates for each trapping type used were calculated as: ((total # captures/ # trap nights) x 100), and this was calculated for each year of the project (see Table 4). Cat detections are shown by line graphs and spatial maps (Figures 12-15).
Rat tracking was calculated by reading ink cards, and for additional rodent monitoring analysis, we conducted Pearson chi-square tests or Fisher's Exact Tests (when frequency <5) to compare the frequency of cards with and without tracks for rats for tracking tunnels (Figures 9-11). We conducted two-sample t-tests to compare the cat detection rates in North vs. South.
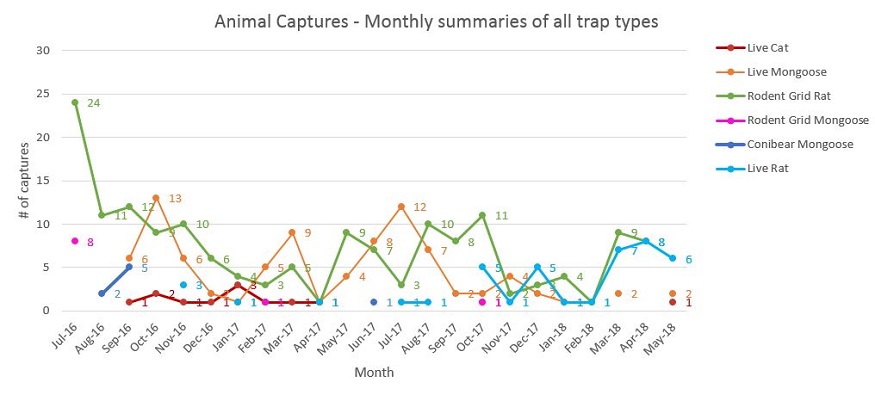 Figure 8. Monthly summaries of all animal captures for each trap type from start of trapping efforts in July 2016 to current May 2018 summaries.
|
Trap Type |
2016 |
2017 |
2018 |
|
Conibear |
0.07% |
0 |
n/a |
|
Goodnature A24 |
0.83% |
0.34% |
0.23% |
|
Live Cage Trap |
3.13% |
0.96% |
0.24% |
|
Live Rat Trap |
n/a |
2.84% |
1.39% |
Table 4. Annual capture rates per trap type.
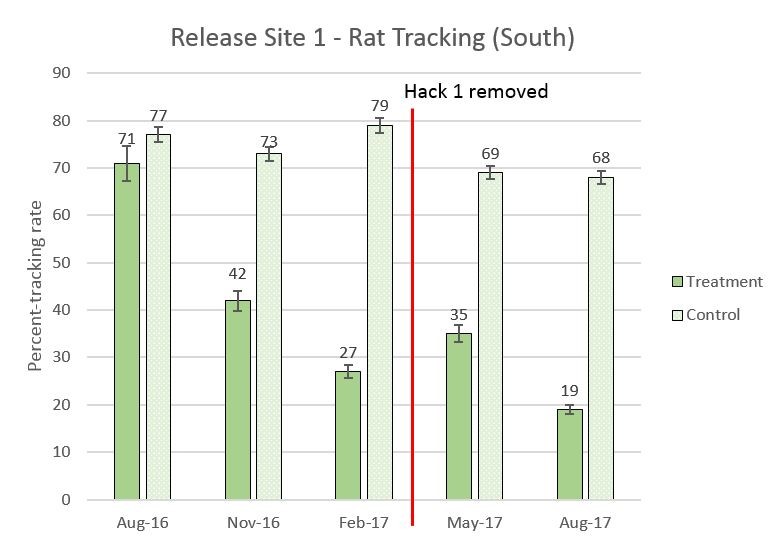 Figure 9. One year of rat tracking for Release Site 1, August 2016 to August 2017. Note the rodent grid was removed in March 2017. There was a significant difference between the baseline treatment and control and the August 2017 treatment and control for rat tracking (χ2 =21.68, df = 3, p<0.0001).
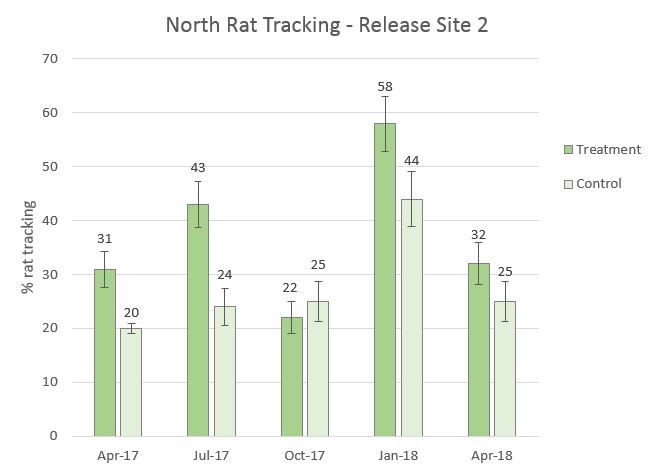
Figure 10. One year of rat tracking at Release Site 2, April 2017 to April 2018. There was no significant difference between April 2017 baseline treatment and control and Oct. 2017 treatment and control for rat tracking (χ2 = 1.114, df = 3, P = 0.7736). There was also no significant difference between baseline treatment and control and April 2018 treatment and control for rat tracking (χ2 = 5.531, df = 3, P = 0.1368).
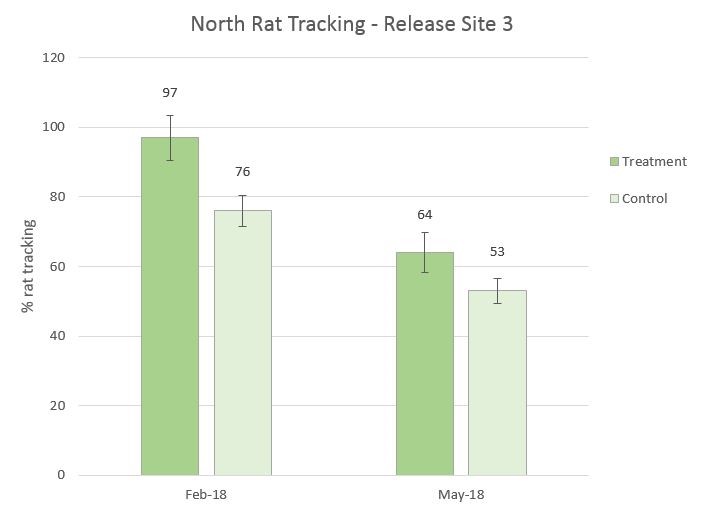 Figure 11. Release Site 3 rat tracking with February 2018 baseline and May 2018 first run after treatment. There was a significant difference between Feb. 2018 baseline treatment and control and the first run in May 2018 treatment and control for rat tracking (χ2 =10.632, df=3, p= 0.0139)
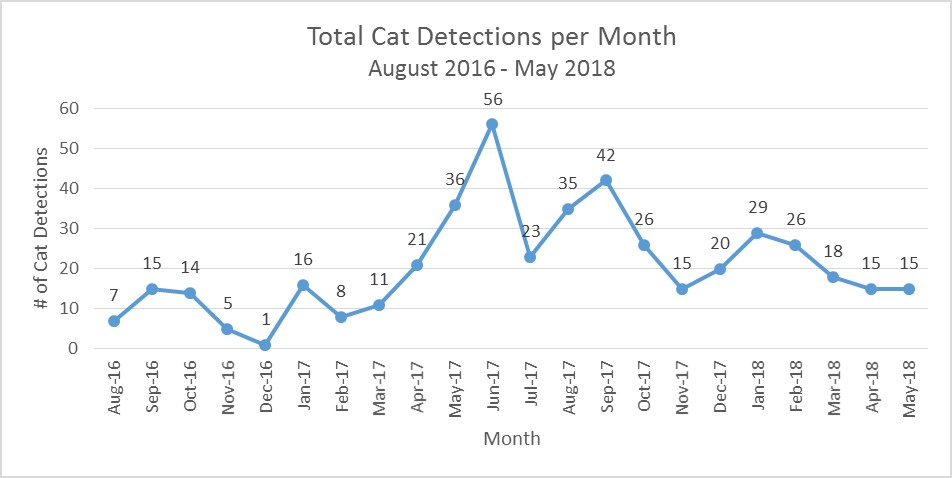 Figure 12. Total cat detections per month from August 2016 to May 2018. There was a total of 8 cameras in August 2016 with additional cameras overtime for a current total of 21 cameras in May 2018.
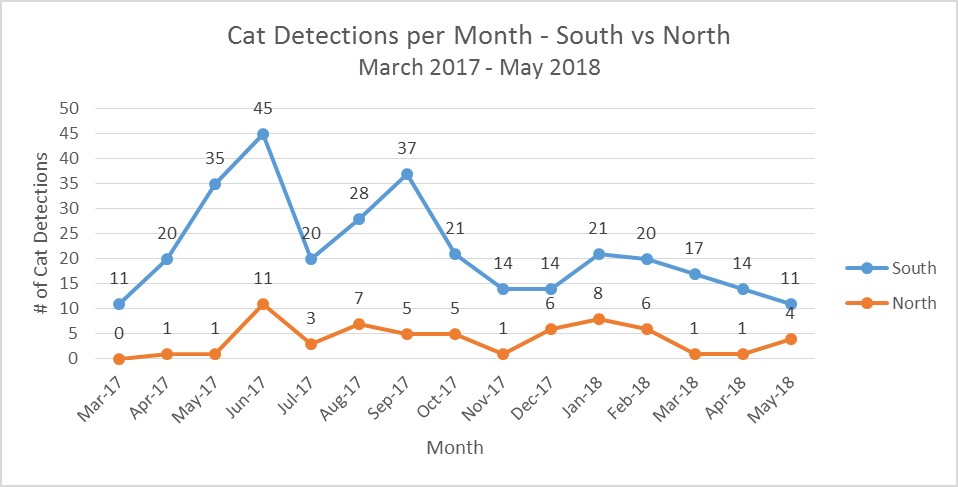 Figure 13. Total cat detections per month separated by North and South cameras from March 2017 to May 2018. This graph does not include pre-standardized camera detections from August 2016 to February 2017, which were all located in the Southern section of the NAR. The South detection (M=21.9, SD=10.1) and North detection (M=4.0, SD=3.2); t(17)=6.52, p<0.01) rates were significantly different from March 2017- May 2018. Note- spike in June 2017 (n=45) in the South was due to a family group.
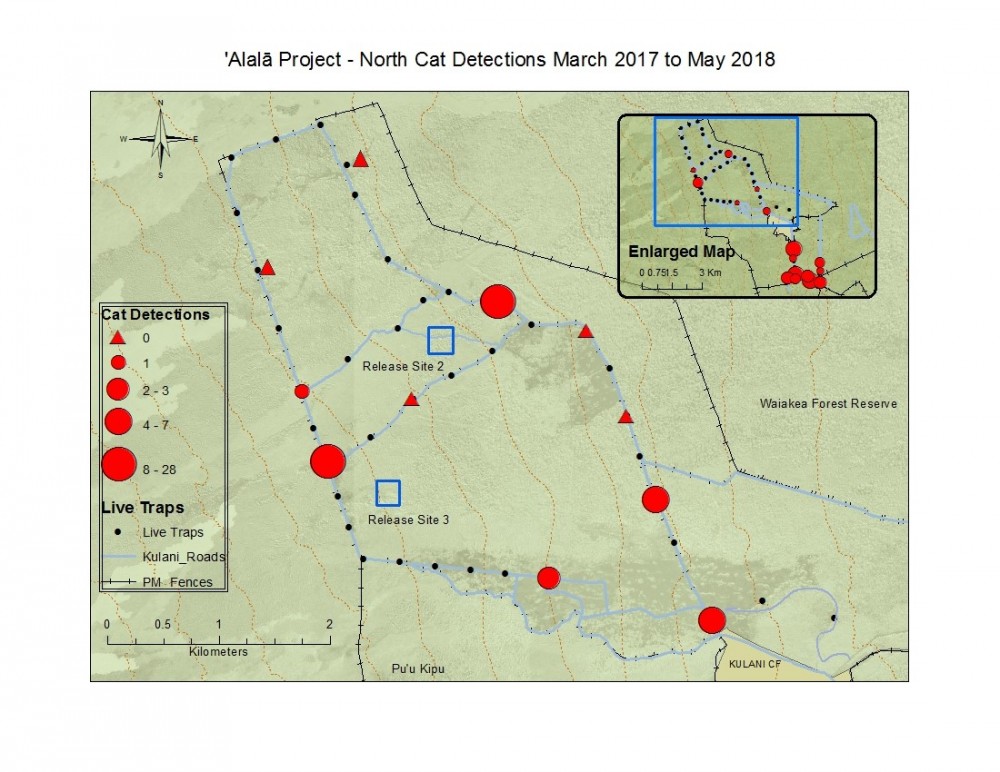 Figure 14. Total North camera trap cat detections with graduated symbols showing spatial density of cats across the landscape from March 2017 to current May 2018 data.
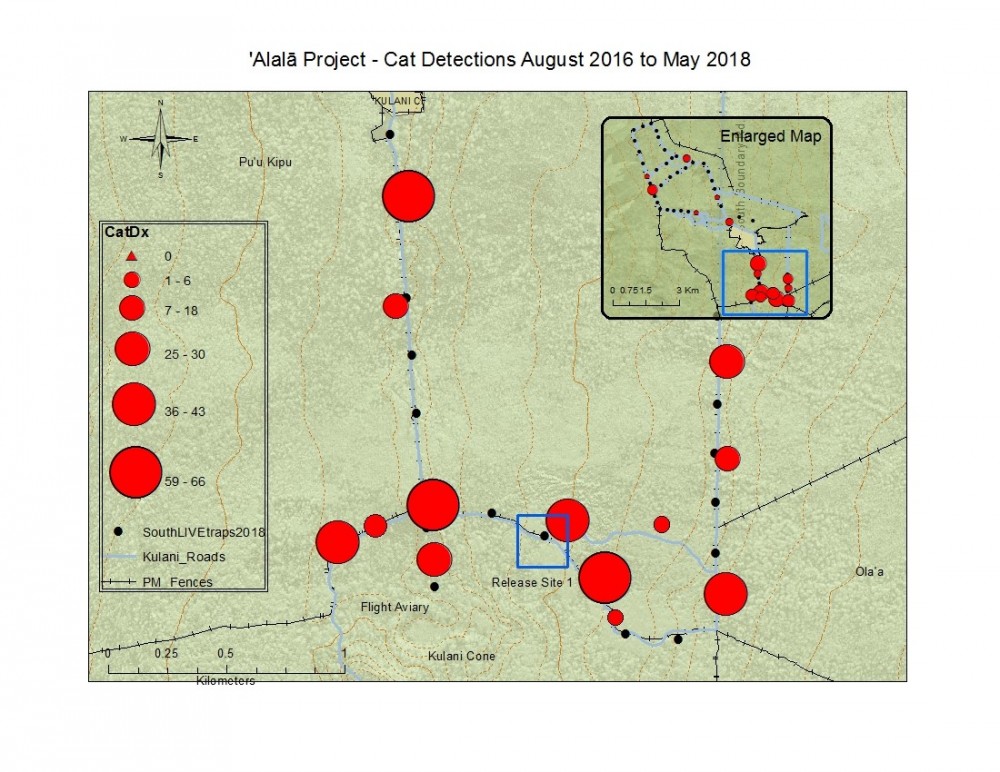 Figure 15. Total South camera trap cat detections with graduated symbols showing spatial density of cats across the landscape from August 2016 to current May 2018 data. This map shows pre and post-standardized cameras.
Results
Figure 8. Monthly summaries of all animal captures for each trap type from start of trapping efforts in July 2016 to current May 2018 summaries.
|
Trap Type |
2016 |
2017 |
2018 |
|
Conibear |
0.07% |
0 |
n/a |
|
Goodnature A24 |
0.83% |
0.34% |
0.23% |
|
Live Cage Trap |
3.13% |
0.96% |
0.24% |
|
Live Rat Trap |
n/a |
2.84% |
1.39% |
Table 4. Annual capture rates per trap type.
Figure 9. One year of rat tracking for Release Site 1, August 2016 to August 2017. Note the rodent grid was removed in March 2017. There was a significant difference between the baseline treatment and control and the August 2017 treatment and control for rat tracking (χ2 =21.68, df = 3, p<0.0001).
Figure 10. One year of rat tracking at Release Site 2, April 2017 to April 2018. There was no significant difference between April 2017 baseline treatment and control and Oct. 2017 treatment and control for rat tracking (χ2 = 1.114, df = 3, P = 0.7736). There was also no significant difference between baseline treatment and control and April 2018 treatment and control for rat tracking (χ2 = 5.531, df = 3, P = 0.1368).
Figure 11. Release Site 3 rat tracking with February 2018 baseline and May 2018 first run after treatment. There was a significant difference between Feb. 2018 baseline treatment and control and the first run in May 2018 treatment and control for rat tracking (χ2 =10.632, df=3, p= 0.0139)
Figure 12. Total cat detections per month from August 2016 to May 2018. There was a total of 8 cameras in August 2016 with additional cameras overtime for a current total of 21 cameras in May 2018.
Figure 13. Total cat detections per month separated by North and South cameras from March 2017 to May 2018. This graph does not include pre-standardized camera detections from August 2016 to February 2017, which were all located in the Southern section of the NAR. The South detection (M=21.9, SD=10.1) and North detection (M=4.0, SD=3.2); t(17)=6.52, p<0.01) rates were significantly different from March 2017- May 2018. Note- spike in June 2017 (n=45) in the South was due to a family group.
Figure 14. Total North camera trap cat detections with graduated symbols showing spatial density of cats across the landscape from March 2017 to current May 2018 data.
Figure 15. Total South camera trap cat detections with graduated symbols showing spatial density of cats across the landscape from August 2016 to current May 2018 data. This map shows pre and post-standardized cameras.
We also mahalo the Kupu Hawai'i internship program for our amazing project interns (‘Ama Lily, Mamo Waianuhea, Stephanie Levins, Cody Yamaguchi, Julia Espaniola, and Kirie Santos), and additional volunteer field assistance from the Mauna Kea Forest Restoration Project, Three Mountain Alliance, and Hawai‘i Island Natural Area Reserves staff. We are also grateful to the valuable input and guidance we have received from the members of our project’s Predator Control Advisory Council.

Figure 16. ‘Alalā Working Group partnership chart
Literature Cited
Dubey J.P., Beattie C.P. 1988. Toxoplasmosis of Animals and Man. CRC Press, Boca Raton, Florida. 220 pp.
Gaudioso-Levita, J.M., A. Greggor, B. Masuda, R. Swaisgood, J. Nelson, D.L. Ball, T. C. Cole, P. Banko, J.P. Vetter, J. Pang-Ching, S. Farabaugh, A.X. Wang, and D. Shier. 2017. ‘Alala Reintroduction Plan (June 21st, 2017 version)
Hess, S. C., P. C. Banko, D. M. Goltz, R. M. Danner, and K. W. Brinck. 2004. Strategies for reducing feral cat threats to endangered Hawaiian birds. Proceedings of the Vertebrate Pest Conference 21: 21-26.
Hess, S.C 2011 By land and by sea: The widespread threat of feral cats on Hawaiian wildlife. The Wildlife Professional 5(1): 66-67.
Hutchison, W. M., Dunachie, J. F., Siim, J. C., & Work, K. (1969). Life cycle of toxoplasma gondii. British Medical Journal, 4(5686), 806.
VanderWerf, E. A., R. A. Switzer, A. A. Lieberman, and R. R. Swaisgood. 2013. ‘Alalā Restoration Plan. Pacific Rim Conservation and San Diego Zoo Global. September 2013.
Wallace, G. D, L. Marshall and M. Marshall. 1972. Cats, rats, and toxoplasmosis on a small Pacific island. American Journal of Epidemiology 95: 475–482.
Work, T.M., J. G. Massey, B. A. Rideout, C. H. Gardiner, D. B. Ledig, O. C. H. Kwok, and J. P. Dubey (2000) Fatal toxoplasmosis in free-ranging endangered ‘Alalā from Hawaii. Journal of Wildlife Diseases: April 2000, Vol. 36, No. 2, pp. 205-212.
Acknowledgements
We also mahalo the Kupu Hawai'i internship program for our amazing project interns (‘Ama Lily, Mamo Waianuhea, Stephanie Levins, Cody Yamaguchi, Julia Espaniola, and Kirie Santos), and additional volunteer field assistance from the Mauna Kea Forest Restoration Project, Three Mountain Alliance, and Hawai‘i Island Natural Area Reserves staff. We are also grateful to the valuable input and guidance we have received from the members of our project’s Predator Control Advisory Council.
Figure 16. ‘Alalā Working Group partnership chart
Literature Cited
Dubey J.P., Beattie C.P. 1988. Toxoplasmosis of Animals and Man. CRC Press, Boca Raton, Florida. 220 pp.
Gaudioso-Levita, J.M., A. Greggor, B. Masuda, R. Swaisgood, J. Nelson, D.L. Ball, T. C. Cole, P. Banko, J.P. Vetter, J. Pang-Ching, S. Farabaugh, A.X. Wang, and D. Shier. 2017. ‘Alala Reintroduction Plan (June 21st, 2017 version)
Hess, S. C., P. C. Banko, D. M. Goltz, R. M. Danner, and K. W. Brinck. 2004. Strategies for reducing feral cat threats to endangered Hawaiian birds. Proceedings of the Vertebrate Pest Conference 21: 21-26.
Hess, S.C 2011 By land and by sea: The widespread threat of feral cats on Hawaiian wildlife. The Wildlife Professional 5(1): 66-67.
Hutchison, W. M., Dunachie, J. F., Siim, J. C., & Work, K. (1969). Life cycle of toxoplasma gondii. British Medical Journal, 4(5686), 806.
VanderWerf, E. A., R. A. Switzer, A. A. Lieberman, and R. R. Swaisgood. 2013. ‘Alalā Restoration Plan. Pacific Rim Conservation and San Diego Zoo Global. September 2013.
Wallace, G. D, L. Marshall and M. Marshall. 1972. Cats, rats, and toxoplasmosis on a small Pacific island. American Journal of Epidemiology 95: 475–482.
Work, T.M., J. G. Massey, B. A. Rideout, C. H. Gardiner, D. B. Ledig, O. C. H. Kwok, and J. P. Dubey (2000) Fatal toxoplasmosis in free-ranging endangered ‘Alalā from Hawaii. Journal of Wildlife Diseases: April 2000, Vol. 36, No. 2, pp. 205-212.
