The Green Machine: Integrating Science, Culture, and Sustainability at the Hawai'i Nature Center
The Green Machine, also known as the Living Machine, is a constructed wetland located in Makiki Valley, Oʻahu, that processes wastewater for both the Hawai‘i Nature Center (HNC) and the Department of Land and Natural Resources (DLNR), Division of Forestry and Wildlife (DOFAW) Baseyard. With predictions of decreased precipitation in the Hawaiian Islands as a result of global warming, combined with an increasing island population, the Green Machine highlights wise reuse of freshwater. Consisting of a metal tank divided into 7 sets of treatment cells (14 cells total), the Green Machine contains an array of microbes, plants (including native kohekohe and makaloa), and small aquatic animals that recycle nutrients and naturally treat wastewater, thereby mimicking the process of a natural wetland. The treated effluent is then used to irrigate a native plant garden of loulu, koa, ‘ōhi‘a lehua and others.
HNC has been using the Green Machine to teach environmental science concepts for over 10 years, most recently incorporating the cutting-edge scientific field of biomimicry into curricula to showcase nature-inspired sustainable design as a solution to current environmental problems.
This poster presents preliminary data on the amount of effluent from the Green Machine as well as data collected with a water quality probe (YSI ProDSS) for quantitative and comparative analyses between treatment cells of the Green Machine. The Green Machine serves as an invaluable teaching tool at the intersection of science, culture, and sustainability that can inspire innovative approaches to island stewardship in future generations.
Quantitative Data collection
The Green Machine has been widely utilized by HNC in qualitative scientific analyses and cultural lessons, but the quantitative potential has not been fully explored. The purpose of this section is to share recently gathered quantitative data on the Green Machine and consider how it might be incorporated into environmental education programs at HNC in the future.
Flow Meter Data
Green Machine Usage and Capacity: Monitoring Effluent Flow
The Green Machine is capable of handling up to 3000-6000 gallons of wastewater per day (Roth 2015). While it is clear that its combined usage by HNC and the DOFAW Baseyard has never approached these levels, the actual volume of treated wastewater has always been unknown. In March 2017, a flow meter was installed on the Green Machine effluent pipe to quantify the amount of treated wastewater that flows to the irrigation field.
The amount of effluent from the Green Machine depends on the amount of water being inputted into the system. There are three sources of water that contribute to the total volume of water in the Green Machine system: 1) water usage at HNC; 2) rainfall that enters into the open-aired treatment cells; and 3) water usage at DOFAW.
1) Water input from HNC. Wastewater created by HNC comes from a kitchen sink, an outdoor sink, and two bathrooms. The boys bathroom has one sink, one low-flow urinal (1 gallon per flush), and one low-flow toilet (1.6 gpf). The girls bathroom has one sink, and two low-flow toilets (1.6 gpf). Observations suggest that larger volumes of effluent aligns with larger groups onsite. More people using the bathrooms means more water moving through the Green Machine.
2) Water input from rainfall. Rain adds freshwater to the Green Machine system equally across treatment cells, but rainwater accumulates in cell B7 because there is no outlet. Observation suggest greater rainfall results in more effluent. Rainfall causes the cells to fill and moves water through the entire system more quickly. In turn, cell A7, the irrigation tank, fills more quickly, in addition to water added directly from the rain. 3) Water input from DLNR. The number of on site personnel and water usage at the DOFAW Baseyard was not determined; thus is it unknown how much wastewater DLNR contributes to the Green Machine system. The amount of water would likely fluctuate depending on the number of staff onsite on any given day. Because the Baseyard has a relatively small number of staff onsite during the day, the contribution of water from DLNR is likely, on average, the lowest of the three.
Effluent Data Collection
From a sample period of six months (January – June 2018), 38 flow meter readings were recorded and used to calculate the average number of gallons per day (daily flow rates) of treated wastewater for the total sample period and between each reading. The shortest interval between readings was 2 days and the longest 12 days.
Data was examined for any correlations between high flow rates and a busy teaching schedule at HNC or rainfall. Changes in usage by DLNR was not factored in but was assumed to be relatively constant with minimal change in number of individuals at the Baseyard.
Results: Average daily flow rates (gallons/day) of effluent
The average flow rate calculated from 38 readings was 425.23 gallons of wastewater per day, which is far below the capacity of 3,000-6,000 gallons per day at the Green Machine’s former site.
The highest three readings were:
- 1119.2 gallons/day from April 6-April 16 (10 day period)
- 1196.14 gallons/day from Feb 26-March 5 (10 day period)
- 1143.14 gallons/day from Feb 9-Feb 16 (12 day period)
The lowest three readings were:
- 0 gallons/day from Feb 7-Feb 8 (1 day period)
- 0.5 gallons/day from March 7-March 9 (2 day period)
- 0.75 gallons/day from Dec 29-Jan 2 (4 day period)
Correlation between effluent flow rates and duration between measurements
The longer the time between effluent flow readings, the greater the calculated average daily flow rates. These highs and lows show that while the calculated daily flow rates are useful for comparison and give an approximate of daily effluent flow, calculations over a longer interval don’t necessarily reflect exact amounts of effluent each day, because water input fluctuates on a daily basis.
Discrepancy between average and actual flow rates
It was clear that in some cases average differed from the actual flow rates. For example, if Friday and Saturday both had an average flow rate of 50 gallons per day, all of the water may have been added on Friday (100 gallons) with multiple programs and no water added on a slow Saturday (0 gallons). In some cases, discrepancies between average and actual flow rates may also reflect the lag time between water moving through the Green Machine into the irrigation tank and when water is pumped to the irrigation field through the effluent pipe.
Correlation between effluent flow rates and HNC facilities usage
As expected, the effluent flow rates were higher at times when HNC had either more onsite programs or larger groups onsite. Between April 6 and April 16, the period with the highest average flow rate, HNC hosted preschool and elementary school programs, and a group of 130 middle school students, in addition to 3 weekend programs, a weekend birthday party, and a large group of volunteers. Other high average flow rates reached 921.5 gallons/day over a 2-day period and 832.57 gallons/day over a 7 day period. These high rates both occurred during busy times with either large groups of students or multiple programs on a single day.
Lowest average flow rates occurred during the least busy times. The average flow of 0.75 occurred over the weekend and New Year’s Day when no staff were on site and no programs took place.
Correlation between effluent flow rates and heavy rainfall
The third highest average flow rate of 1143.14 gallons/day occurred between February 9 and February 16. Although there was not a high number of programs nor groups with exceptionally large numbers during that time, this was a period of heavy rainfall, suggesting that rain was the greatest contributing factor to the high flow rate.
YSI ProDSS Probe Data
Integration of YSI Probe Data Collection into Middle School Programs
In 2014 HNC, HNC began its first middle school programs (grades 6-8) that focused on climate change impacts inland and along the coast. The program consisted of a Mauka field trip at HNC in makiki Valley and a Makai field trip at either Sandy Beach or Shark’s Cove. One activity in both programs was the testing of water conditions (temperature, pH, salinity, dissolved oxygen) of Makiki Stream and of coastal tide pools. Students collected data relating to water quality to consider factors which influence stream health and how conditions may be impacted as a result of a changing climate. Because students did both field trips and tested for the same variables, they were able to compare and contrast data between the forest and coastal ecosystems.
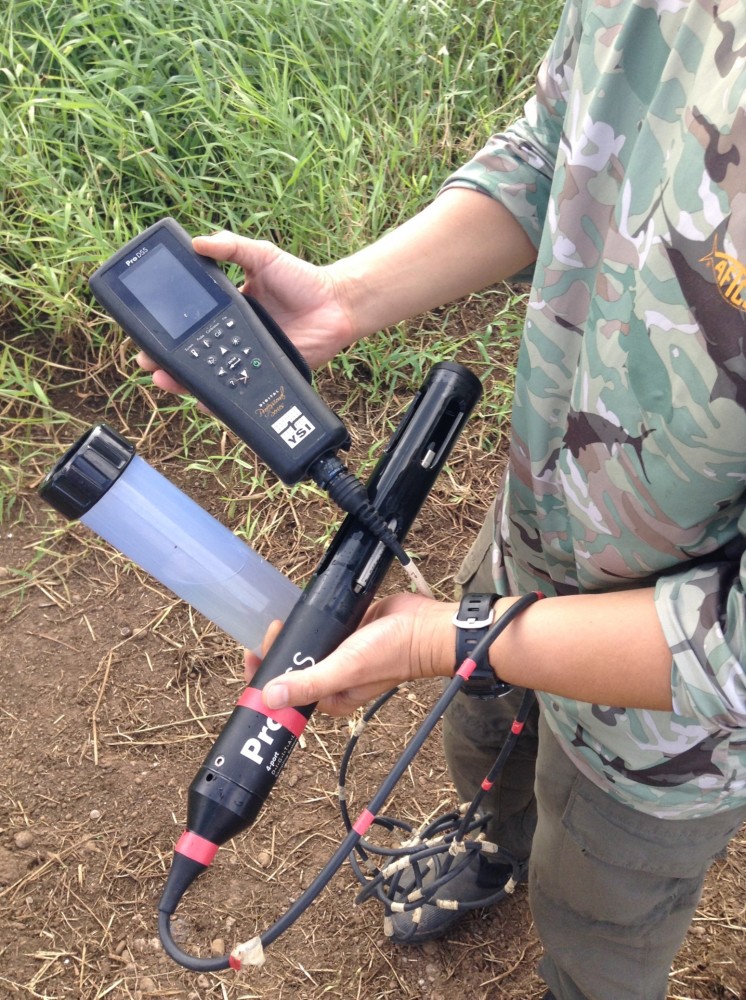
In 2017, the middle school climate change program was expanded to offer a third field trip at the wetland ecosystem of Hamakua Marsh. At that time, HNC was able to purchase a YSI ProDSS probe (YSI) through a grant from NOAA. HNC was also able to borrow an additional YSI from ‘Iolani School when HNC hosted large groups at the wetlands. The YSI allowed for precise testing of water conditions at the wetland marsh, which was done in addition to the hands-on water tests done by students (measuring pH with test strips, using solutions to assess levels of dissolved oxygen, etc.). After data collection, students compared their results to the readings of the YSI and engaged in discussion of any discrepancies between the two data sets.
As a state-of-the-art scientific tool, the YSI allowed HNC Environmental Educators to show students what scientists studying water quality actually use and the types of data they collect, in order to give students a taste of “a day in the life of a scientist.” For future middle school programs, HNC plans to integrate the collecting of data with the YSI into the Mauka and Makai programs as well for consistency and for comparison across all three ecosystems.
YSI Probe and Green Machine Data Collection
Utilizing the YSI for collecting data from the Green Machine came as an idea because middle school students already visit the Green Machine for the Mauka Program during the lesson in biomimicry and they learn about wetland ecosystems during the Wetlands Program. Data collection is a logical next step because 1) data from the Green Machine can be compared to data from Hamakua Marsh for added discussion of similarities and differences between natural and constructed wetlands; 2) data can highlight the value of wetlands’ ability to filter water; 3) data can provide additional information on the value of conserving natural areas.
YSI Data Collection and Results
Using the YSI, temperature (Celsius), pH, salinity (ppt), and dissolved oxygen (ppm) were measured in all 14 treatment cells of the Green Machine cells once a week for 5 months (January-May 2018). Data was typically recorded between 12:30pm and 5:30pm, but occasionally earlier in the day or later in the afternoon. Averages for each cell over the 5-month period are shown below in Table 1.
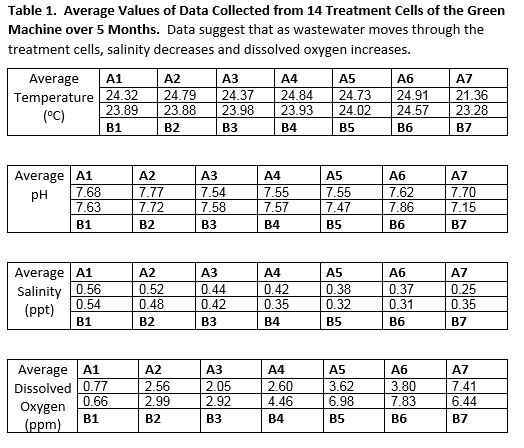
The average temperature ranged only a few degrees, from 21.36 oC in cell A7 to 24.94 oC in cell A6. Average pH was around expected levels for freshwater, just slightly basic, ranging from an average of 7.15 in cell B7 to 7.86 in cell B6. Salinity in all tanks was low as expected for freshwater, ranging from 0.25 ppt to 0.56 ppt. Average dissolved oxygen for all cells was low, with a range from 0.66 ppm to 7.83 ppt.
While data is still being analyzed and statistical significance has not been determined, trends were observed for dissolved oxygen and salinity. As wastewater moved through the treatment process from cells A1 and B1 to cell A7, dissolved oxygen appeared to increase while salinity appeared to decrease.
An increase in dissolved oxygen is expected because oxygenation is an important component of the wastewater treatment process. More oxygen supports beneficial aerobic microorganisms that break down and neutralize harmful compounds in the wastewater.
Visual assessment of treatment cells supports the data as well. Tanks A1 and B1 have no algae and the presence of algae increases in successive tanks. As algae photosynthesize, additional oxygen is added to the water, which would allow more small organisms (fish, shrimp) to survive. As expected, more animals are seen in successive cells.
A decrease in salinity suggests that the wastewater treatment process leads to the breakdown of salts. Urine is known to contain inorganic salts such as sodium (Na+), chloride (Cl-), and sulfate SO42-). As wastewater moves through the treatment cells, these salts may be removed through biochemical reactions or consumed by microorganisms or plants living in the Green Machine.
Future Analysis
Because the primary duty of HNC education staff is the delivery of quality environmental education, time for data analysis is limited. Further data analysis is necessary to determine whether or not the trends of increasing dissolved oxygen and decreasing salinity through the treatment cell process show statistical significance.
For assistance in understanding the data more thoroughly, Environmental Educators plan to consult further with Lauren Roth of Roth Ecological Design, and Cory Yap, an Environmental Research Assistant at UH Mānoa, who has provided much assistance on use of the YSI and observed trends in streams and wetlands on O‘ahu.
Due to an unexpected glitch, data that was previously collected with middle school groups at Hamakua Marsh, Makiki Stream, and Sandy Beach was erased from the YSI computer. Future middle school programs will provide an opportunity for data collection and comparisons between these locations at a later time.
In addition to temperature, pH, salinity, and dissolved oxygen, the YSI could be used to measure total dissolved solids (TDS) and turbidity in the Green Machine treatment cells in the future. Both TDS and turbidity can be used as indicators of water quality.
Flow Meter and YSI Data: Preliminary Quantitative Studies
Quantitative Data collection
The Green Machine has been widely utilized by HNC in qualitative scientific analyses and cultural lessons, but the quantitative potential has not been fully explored. The purpose of this section is to share recently gathered quantitative data on the Green Machine and consider how it might be incorporated into environmental education programs at HNC in the future.
Flow Meter Data
Green Machine Usage and Capacity: Monitoring Effluent Flow
The Green Machine is capable of handling up to 3000-6000 gallons of wastewater per day (Roth 2015). While it is clear that its combined usage by HNC and the DOFAW Baseyard has never approached these levels, the actual volume of treated wastewater has always been unknown. In March 2017, a flow meter was installed on the Green Machine effluent pipe to quantify the amount of treated wastewater that flows to the irrigation field.
The amount of effluent from the Green Machine depends on the amount of water being inputted into the system. There are three sources of water that contribute to the total volume of water in the Green Machine system: 1) water usage at HNC; 2) rainfall that enters into the open-aired treatment cells; and 3) water usage at DOFAW.
1) Water input from HNC. Wastewater created by HNC comes from a kitchen sink, an outdoor sink, and two bathrooms. The boys bathroom has one sink, one low-flow urinal (1 gallon per flush), and one low-flow toilet (1.6 gpf). The girls bathroom has one sink, and two low-flow toilets (1.6 gpf). Observations suggest that larger volumes of effluent aligns with larger groups onsite. More people using the bathrooms means more water moving through the Green Machine.
2) Water input from rainfall. Rain adds freshwater to the Green Machine system equally across treatment cells, but rainwater accumulates in cell B7 because there is no outlet. Observation suggest greater rainfall results in more effluent. Rainfall causes the cells to fill and moves water through the entire system more quickly. In turn, cell A7, the irrigation tank, fills more quickly, in addition to water added directly from the rain. 3) Water input from DLNR. The number of on site personnel and water usage at the DOFAW Baseyard was not determined; thus is it unknown how much wastewater DLNR contributes to the Green Machine system. The amount of water would likely fluctuate depending on the number of staff onsite on any given day. Because the Baseyard has a relatively small number of staff onsite during the day, the contribution of water from DLNR is likely, on average, the lowest of the three.
Effluent Data Collection
From a sample period of six months (January – June 2018), 38 flow meter readings were recorded and used to calculate the average number of gallons per day (daily flow rates) of treated wastewater for the total sample period and between each reading. The shortest interval between readings was 2 days and the longest 12 days.
Data was examined for any correlations between high flow rates and a busy teaching schedule at HNC or rainfall. Changes in usage by DLNR was not factored in but was assumed to be relatively constant with minimal change in number of individuals at the Baseyard.
Results: Average daily flow rates (gallons/day) of effluent
The average flow rate calculated from 38 readings was 425.23 gallons of wastewater per day, which is far below the capacity of 3,000-6,000 gallons per day at the Green Machine’s former site.
The highest three readings were:
- 1119.2 gallons/day from April 6-April 16 (10 day period)
- 1196.14 gallons/day from Feb 26-March 5 (10 day period)
- 1143.14 gallons/day from Feb 9-Feb 16 (12 day period)
The lowest three readings were:
- 0 gallons/day from Feb 7-Feb 8 (1 day period)
- 0.5 gallons/day from March 7-March 9 (2 day period)
- 0.75 gallons/day from Dec 29-Jan 2 (4 day period)
Correlation between effluent flow rates and duration between measurements
The longer the time between effluent flow readings, the greater the calculated average daily flow rates. These highs and lows show that while the calculated daily flow rates are useful for comparison and give an approximate of daily effluent flow, calculations over a longer interval don’t necessarily reflect exact amounts of effluent each day, because water input fluctuates on a daily basis.
Discrepancy between average and actual flow rates
It was clear that in some cases average differed from the actual flow rates. For example, if Friday and Saturday both had an average flow rate of 50 gallons per day, all of the water may have been added on Friday (100 gallons) with multiple programs and no water added on a slow Saturday (0 gallons). In some cases, discrepancies between average and actual flow rates may also reflect the lag time between water moving through the Green Machine into the irrigation tank and when water is pumped to the irrigation field through the effluent pipe.
Correlation between effluent flow rates and HNC facilities usage
As expected, the effluent flow rates were higher at times when HNC had either more onsite programs or larger groups onsite. Between April 6 and April 16, the period with the highest average flow rate, HNC hosted preschool and elementary school programs, and a group of 130 middle school students, in addition to 3 weekend programs, a weekend birthday party, and a large group of volunteers. Other high average flow rates reached 921.5 gallons/day over a 2-day period and 832.57 gallons/day over a 7 day period. These high rates both occurred during busy times with either large groups of students or multiple programs on a single day.
Lowest average flow rates occurred during the least busy times. The average flow of 0.75 occurred over the weekend and New Year’s Day when no staff were on site and no programs took place.
Correlation between effluent flow rates and heavy rainfall
The third highest average flow rate of 1143.14 gallons/day occurred between February 9 and February 16. Although there was not a high number of programs nor groups with exceptionally large numbers during that time, this was a period of heavy rainfall, suggesting that rain was the greatest contributing factor to the high flow rate.
YSI ProDSS Probe Data
Integration of YSI Probe Data Collection into Middle School Programs
In 2014 HNC, HNC began its first middle school programs (grades 6-8) that focused on climate change impacts inland and along the coast. The program consisted of a Mauka field trip at HNC in makiki Valley and a Makai field trip at either Sandy Beach or Shark’s Cove. One activity in both programs was the testing of water conditions (temperature, pH, salinity, dissolved oxygen) of Makiki Stream and of coastal tide pools. Students collected data relating to water quality to consider factors which influence stream health and how conditions may be impacted as a result of a changing climate. Because students did both field trips and tested for the same variables, they were able to compare and contrast data between the forest and coastal ecosystems.
In 2017, the middle school climate change program was expanded to offer a third field trip at the wetland ecosystem of Hamakua Marsh. At that time, HNC was able to purchase a YSI ProDSS probe (YSI) through a grant from NOAA. HNC was also able to borrow an additional YSI from ‘Iolani School when HNC hosted large groups at the wetlands. The YSI allowed for precise testing of water conditions at the wetland marsh, which was done in addition to the hands-on water tests done by students (measuring pH with test strips, using solutions to assess levels of dissolved oxygen, etc.). After data collection, students compared their results to the readings of the YSI and engaged in discussion of any discrepancies between the two data sets.
As a state-of-the-art scientific tool, the YSI allowed HNC Environmental Educators to show students what scientists studying water quality actually use and the types of data they collect, in order to give students a taste of “a day in the life of a scientist.” For future middle school programs, HNC plans to integrate the collecting of data with the YSI into the Mauka and Makai programs as well for consistency and for comparison across all three ecosystems.
YSI Probe and Green Machine Data Collection
Utilizing the YSI for collecting data from the Green Machine came as an idea because middle school students already visit the Green Machine for the Mauka Program during the lesson in biomimicry and they learn about wetland ecosystems during the Wetlands Program. Data collection is a logical next step because 1) data from the Green Machine can be compared to data from Hamakua Marsh for added discussion of similarities and differences between natural and constructed wetlands; 2) data can highlight the value of wetlands’ ability to filter water; 3) data can provide additional information on the value of conserving natural areas.
YSI Data Collection and Results
Using the YSI, temperature (Celsius), pH, salinity (ppt), and dissolved oxygen (ppm) were measured in all 14 treatment cells of the Green Machine cells once a week for 5 months (January-May 2018). Data was typically recorded between 12:30pm and 5:30pm, but occasionally earlier in the day or later in the afternoon. Averages for each cell over the 5-month period are shown below in Table 1.
The average temperature ranged only a few degrees, from 21.36 oC in cell A7 to 24.94 oC in cell A6. Average pH was around expected levels for freshwater, just slightly basic, ranging from an average of 7.15 in cell B7 to 7.86 in cell B6. Salinity in all tanks was low as expected for freshwater, ranging from 0.25 ppt to 0.56 ppt. Average dissolved oxygen for all cells was low, with a range from 0.66 ppm to 7.83 ppt.
While data is still being analyzed and statistical significance has not been determined, trends were observed for dissolved oxygen and salinity. As wastewater moved through the treatment process from cells A1 and B1 to cell A7, dissolved oxygen appeared to increase while salinity appeared to decrease.
An increase in dissolved oxygen is expected because oxygenation is an important component of the wastewater treatment process. More oxygen supports beneficial aerobic microorganisms that break down and neutralize harmful compounds in the wastewater.
Visual assessment of treatment cells supports the data as well. Tanks A1 and B1 have no algae and the presence of algae increases in successive tanks. As algae photosynthesize, additional oxygen is added to the water, which would allow more small organisms (fish, shrimp) to survive. As expected, more animals are seen in successive cells.
A decrease in salinity suggests that the wastewater treatment process leads to the breakdown of salts. Urine is known to contain inorganic salts such as sodium (Na+), chloride (Cl-), and sulfate SO42-). As wastewater moves through the treatment cells, these salts may be removed through biochemical reactions or consumed by microorganisms or plants living in the Green Machine.
Future Analysis
Because the primary duty of HNC education staff is the delivery of quality environmental education, time for data analysis is limited. Further data analysis is necessary to determine whether or not the trends of increasing dissolved oxygen and decreasing salinity through the treatment cell process show statistical significance.
For assistance in understanding the data more thoroughly, Environmental Educators plan to consult further with Lauren Roth of Roth Ecological Design, and Cory Yap, an Environmental Research Assistant at UH Mānoa, who has provided much assistance on use of the YSI and observed trends in streams and wetlands on O‘ahu.
Due to an unexpected glitch, data that was previously collected with middle school groups at Hamakua Marsh, Makiki Stream, and Sandy Beach was erased from the YSI computer. Future middle school programs will provide an opportunity for data collection and comparisons between these locations at a later time.
In addition to temperature, pH, salinity, and dissolved oxygen, the YSI could be used to measure total dissolved solids (TDS) and turbidity in the Green Machine treatment cells in the future. Both TDS and turbidity can be used as indicators of water quality.
The idea for “living machines” began in the 1970s with John Todd and other ecological scientists exploring the potential of natural processes for treating wastewater and addressing other human needs in a sustainable and environmentally friendly way.
Construction of the Green Machine was funded through the Environmental Protection Agency and tested at a wastewater treatment facility in San Francisco. After its successful performance in the Bay Area, treating water to the same or higher levels than standard wastewater treatment practices, the Green Machine was shipped to Hawaiʻi in 2000 (Mālama ‘Ᾱina Foundation 2016). Its performance was tested in treating wastewater from the Farmer’s Livestock Cooperative, a slaughterhouse in ‘Ewa (Roth 2015; Harmon 2015). Operations, along with an educational component, were handled by the Mālama ‘Ᾱina Foundation in cooperation with Partners in Development (Mālama ‘Ᾱina Foundation 2016).
Around the same time as the tests finished in ‘Ewa and the slaughterhouse was closing, the HNC obtained funds to construct a new education classroom in 2006. Connecting this new building to the city’s sewer system was not practical or financially viable, so the Green Machine was brought to Makiki Valley as an affordable wastewater solution with the additional bonus of its educational value. The Green Machine was situated so that treated wastewater from HNC would be pumped to a nearby an irrigation field to establish and cultivate a collection of native and Polynesian-introduced plants. Operations were maintained by Partners in Development who continued to use the Green Machine for education as well.
Some years later, DLNR’s Department of Forestry and Wildlife (DOFAW) Baseyard, also in Makiki Valley, connected to the Green Machine when their septic tank system became obsolete, and both entities utilize the Green Machine today. In 2016, ownership and maintenance of the Green Machine was transferred from Partners in Development to the Hawai‘i Nature Center with consultation and support provided by Roth Ecological Design. Hawai‘i Nature Center continues to partner with DOFAW for the management and maintenance of the Green Machine as a wastewater treatment system and educational tool.
Water Conservation
Freshwater comprises only about 3% of the total volume of water on Earth, and accessible freshwater amounts to a minute fraction of 1% (USGS 2016). The combination of an ever-growing global population, numerous sources of freshwater contamination, including industrial technology and intensive agricultural practices (CDC 2016), and multiple uses of freshwater for purposes besides drinking, such as in technologies like mining and cooling systems (Venu 2015), highlight the importance of conserving this already limited resource.
Freshwater as a finite resource is particularly noticeable in an island setting. Recognizing the value of this resource and taking measures to protect it are part of traditional Hawaiian practices and have continued in importance over the past centuries up to the present (BWS 2018). Drought conditions have become more frequent in the past 30 years and data show that the number of yearly tradewind days has decreased over the past several decades, meaning less consistent rainfall that can replenish groundwater supplies (Gazra, Chu, Norton 2012). In addition, rising sea levels resulting from climate change may threaten existing water supplies through saltwater intrusion into the freshwater basal lens (EPA 2016).
Standard wastewater systems consume large quantities of freshwater. In 2017, approximately 117 million gallons of wastewater were produced daily on O‘ahu (Office of the City Auditor 2017) and approximately $511.4 million was budgeted for solid waste, sewage collection, and disposal projects. (City and County of Honolulu, 2017). Water that could otherwise be used for drinking or bathing is instead contaminated with urine and feces.
The Green Machine is a tangible alternative to standard wastewater systems. Instead of one-time use, wastewater is cleaned and then reused for irrigation. In teaching place-based education, traditional Hawaiian values of freshwater (wai = freshwater; waiwai = wealth) and the protocols that ensured its protection are important lessons for practicing wise stewardship of freshwater today. Every child or group that visits the Hawai‘i Nature Center can actively participate in water conservation simply by using the bathroom!
Wetland Conservation
Both worldwide and in the United States, over half of the once-existing wetlands have been lost (WWF 2018; NRCS 2018). In the past, wetlands in Hawai‘i were considered wastelands by developers, and wetlands now comprise less than 3% of the state, with significant wetland loss due to residential and industrial development (USGS 1999).
Wetlands are now recognized across the globe as valuable and important ecosystems for their many benefits, including water filtration and pollutant removal, storm protection and flood control, and essential habitat for many plants and animals (WWF 2018). The benefits and services they provide for free can save governments and individuals millions of dollars (Akpan 2017).
As a self-contained, constructed wetland at an environmental education center located in a valley, Green Machine provides a special opportunity to observe firsthand the same benefits of a natural wetland. Incorporating the Green Machine into educational programs allows students and adults to see how wetlands filter water and provide habitat for unique species such as native Hawaiian plants. Seeing and understanding how the Green Machine works highlights the value in wetland conversation locally and globally.
The Green Machine, also known as the Living Machine, is a self-contained, constructed wetland system that takes an innovative and sustainable approach to treat wastewater. In contrast to standard wastewater treatment methods that are expensive, use harmful chemicals, and produce toxic byproducts, the Green Machine employs principles of ecological design (biological design) that work in harmony with the environment by integrating natural cycles and living organisms in the wastewater treatment process (Todd and Todd 1993). Freshwater that would normally become unusable is recycled for use in irrigation. Consisting of a steal tank divided into 2 sets of 7 treatment cells (14 cells in total), the Green Machine contains an array of microbes, plants and small aquatic animals that recycle nutrients and remove pollutants by mimicking processes of a natural wetland (Figure 2). The Hawai‘i Department of Health recognizes three levels of water reuse based on the level of treatment it undergoes, with R-1 being the highest and R-3 being the lowest. The Green Machine is able to exceed Hawai’i Department of Health R-3 reuse level standards by meeting criteria of 10 mg/L of total dissolved solids and 10 mg/L biochemical oxygen demand, and incorporates R-2 reuse level practices of both oxidation and chlorine disinfection (Roth 2015; DOH 2002).
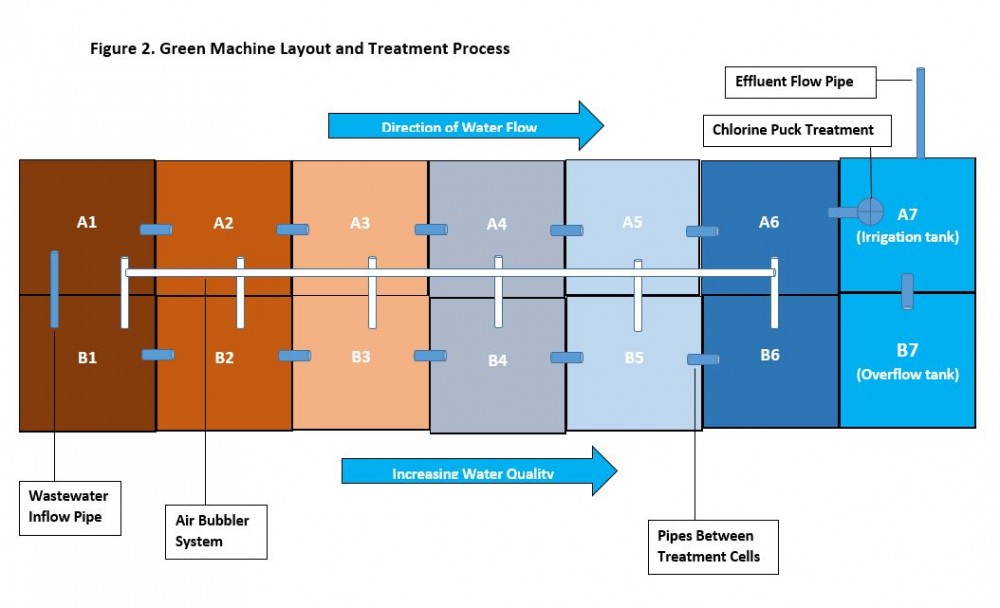
Steps of wastewater treatment at the Green Machine (Figure 2) are as follows:
- Wastewater is pumped from HNC into treatment cells A1 and B1.
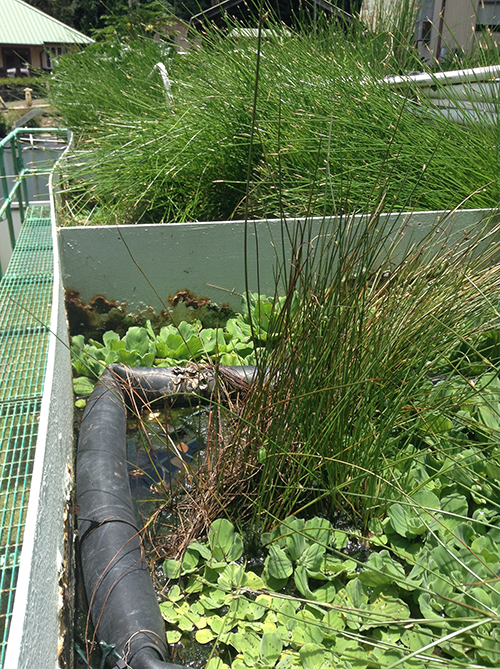
- A bubbler system releases air underwater in cells A1-A6 and B1-B6 to introduce oxygen for aerobic wastewater treatment and to promote circulation of nutrients and organisms. The treatment cells contain an array of microorganisms, algae, freshwater snails, small fish, and aquatic plants that all assist in the treatment process.
- Water flows successively through cells A2-A6 and/or B 2-B6 via underwater pipes between cells. Water becomes noticeably cleaner in each cell with an increase in abundance of fish and snails.
- As treated water is directed into cell A7 (irrigation tank), it passes through a net with a chlorine puck for a final step in treatment.
- Cell B7 serves as an overflow tank if cell A7 fill above capacity. Under normal conditions, the only water in cell B7 is rainwater that falls directly into the tank.
- Under normal conditions, when the irrigation tank fills to a certain height, a pump is automatically triggered and the treated wastewater is sent through an effluent pipe to the irrigation field to water native and Polynesian-introduced plants. The pump can be turned on manually to send water to the irrigation field or back into cells A1 and B2 for an additional cycle of treatment.
The Green Machine: How it Works
The Green Machine, also known as the Living Machine, is a self-contained, constructed wetland system that takes an innovative and sustainable approach to treat wastewater. In contrast to standard wastewater treatment methods that are expensive, use harmful chemicals, and produce toxic byproducts, the Green Machine employs principles of ecological design (biological design) that work in harmony with the environment by integrating natural cycles and living organisms in the wastewater treatment process (Todd and Todd 1993). Freshwater that would normally become unusable is recycled for use in irrigation. Consisting of a steal tank divided into 2 sets of 7 treatment cells (14 cells in total), the Green Machine contains an array of microbes, plants and small aquatic animals that recycle nutrients and remove pollutants by mimicking processes of a natural wetland (Figure 2). The Hawai‘i Department of Health recognizes three levels of water reuse based on the level of treatment it undergoes, with R-1 being the highest and R-3 being the lowest. The Green Machine is able to exceed Hawai’i Department of Health R-3 reuse level standards by meeting criteria of 10 mg/L of total dissolved solids and 10 mg/L biochemical oxygen demand, and incorporates R-2 reuse level practices of both oxidation and chlorine disinfection (Roth 2015; DOH 2002).
Steps of wastewater treatment at the Green Machine (Figure 2) are as follows:
- Wastewater is pumped from HNC into treatment cells A1 and B1.
- A bubbler system releases air underwater in cells A1-A6 and B1-B6 to introduce oxygen for aerobic wastewater treatment and to promote circulation of nutrients and organisms. The treatment cells contain an array of microorganisms, algae, freshwater snails, small fish, and aquatic plants that all assist in the treatment process.
- Water flows successively through cells A2-A6 and/or B 2-B6 via underwater pipes between cells. Water becomes noticeably cleaner in each cell with an increase in abundance of fish and snails.
- As treated water is directed into cell A7 (irrigation tank), it passes through a net with a chlorine puck for a final step in treatment.
- Cell B7 serves as an overflow tank if cell A7 fill above capacity. Under normal conditions, the only water in cell B7 is rainwater that falls directly into the tank.
- Under normal conditions, when the irrigation tank fills to a certain height, a pump is automatically triggered and the treated wastewater is sent through an effluent pipe to the irrigation field to water native and Polynesian-introduced plants. The pump can be turned on manually to send water to the irrigation field or back into cells A1 and B2 for an additional cycle of treatment.
The Green Machine has become an essential component in teaching an array of environmental concepts across a range of ages. Some of these general lessons across all ages and programs include:
- Demonstrating environmental stewardship and sustainable practices.
- The Green Machine allows HNC to embody concepts of environmental stewardship that it teaches while providing a tangible example of a sustainable practice (i.e. water conservation/recycling). Children that visit HNC are encouraged to take care of our island resources and they can see HNC doing the same. The Green Machine is one of several ways HNC actively embodies stewardship that it promotes. In addition to the Green Machine, HNC has rooftop solar panels, rainwater catchment barrels, food gardens and native plant gardens, composting worms and compost piles, recycling bins, and aquaponics systems.
- Qualitative Analyses.
- Students are actively engaged when they visit the Green Machine by using their visual and olfactory senses to qualitatively assess the water treatment process. As students move along the treatment cells of the Green Machine, the strong odor decreases while water clarity and abundance of aquatic organisms (algae, fish, snails) increases. These changes are apparent to students young and old, and because they are typical indicators of water quality, students can apply this knowledge in other contexts.
- Visits to the Green Machine may be linked with activities at Makiki Stream to allow students to observe similarities and differences between the two. When time permits, water samples from both the stream and the Green Machine are collected and taken back to the HNC classroom to compare and contrast under stereo microscopes and compound microscopes.
- Water Conservation and Sustainability.
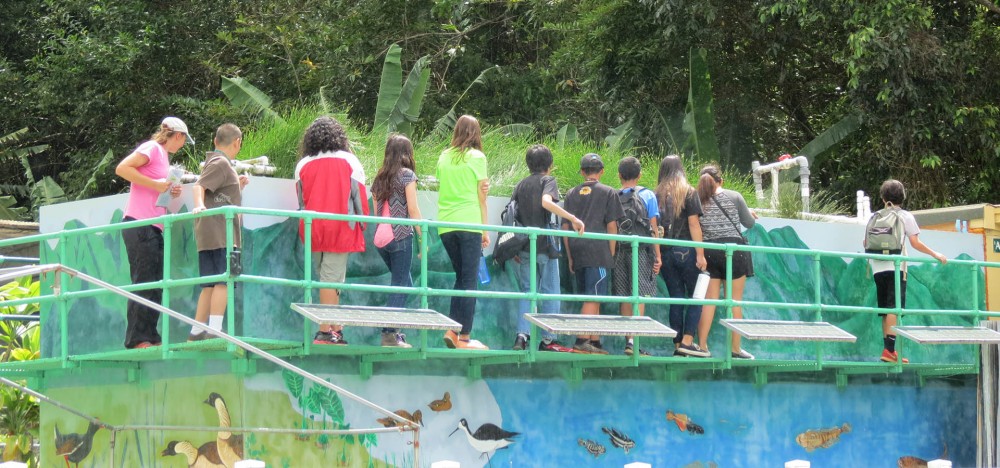
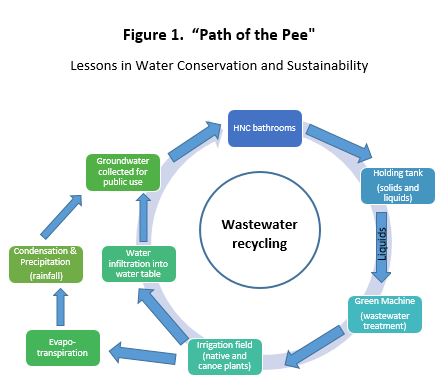
- The Green Machine exemplifies one strategy for water conservation and for taking care of finite island resources today with the future in mind. Groups are taken on a short tour that follows the “Path of the Pee” (Figure 1). The tour begins at the HNC bathrooms, moves to the wastewater holding tanks underneath the HNC lawn, proceeds to the Green Machine where the waste water treatment occurs, and finally to the irrigation field with native and Polynesian-introduced plants watered by the treated effluent. The short and interactive “Path of the Pee” tours are an important component in a variety of HNC programs, including overnight camps, intersession day camps, and custom programs with adults and/or international students.
- Wetland Services and Benefits.
- The Green Machine provides a unique opportunity for HNC educators to teach about wetland services and wetland ecology in Makiki Valley. As a self-contained constructed wetland, the Green Machine allows for a first-hand look at the many benefits one would observe by visiting a natural marsh wetland, including habitat and/or resources for plants and animals, removal and filtration of pollutants from water, and ecosystem interactions (gas exchange, nutrient processing, plant and algal growth rates, etc.).
The Green Machine is also a useful tool for teaching place-based cultural lessons and for teaching concepts of biomimicry.
- Lessons in Biomimicry with middle school students and intersession day camps.
- Biomimicry describes the emulation of nature’s systems, patterns, or designs to solve human challenges. This cutting edge, interdisciplinary field of science has become increasingly valuable for its applications in offering sustainable alternatives to practices that cause environmental degradation. The Green Machine highlights the sustainable aspect of biomimicry in its replication of a wetland marsh to naturally clean water so it can be reused. Ecological design, the principles upon which the Green Machine was constructed, can be considered a sub-category of biomimicry: whereas biomimicry copies features of natural systems or takes inspiration from them (without necessarily integrating the living components), ecological or biological design purposefully integrates natural living systems into the technology.
- Middle school students participating in HNC’s climate change program are introduced to biomimicry as a field of science that can offer solutions for mitigating the effects of climate change. Students are taken on the “Path of the Pee” tour and are encouraged to qualitatively assess the wastewater treatment process. Concepts of biomimicry are further elaborated upon and other examples of nature-inspired sustainable design are discussed, including architecture, clothing, and transportation. The lesson ends by engaging students in a hands-on biomimicry activity: building solar ovens with shoeboxes. Students are challenged to integrate aspects of biomimicry (specifically nature’s lessons in insulation and heat absorption) in their designs; to achieve this goal, they are given a variety of materials to creatively reuse (bubble wrap, newspaper, single-use plastic containers, etc.). Lessons and activities in biomimicry are similar for intersession day camps, but concepts are simplified for this younger group of children, ages 6-11.
- Cultural Education with intersession day camps and overnight camps students.
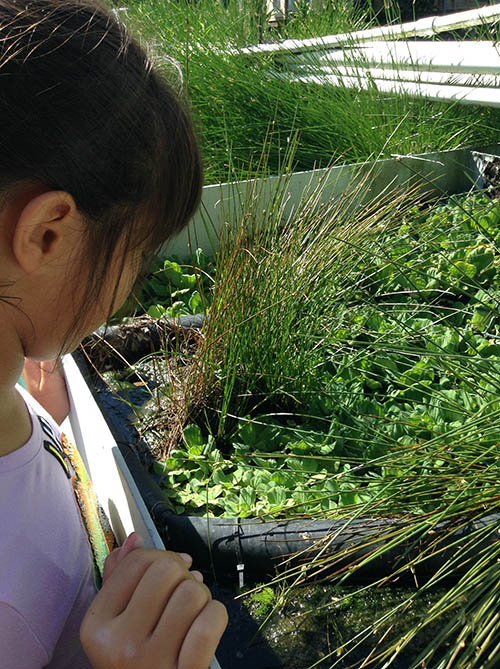
- The Green Machine most closely replicates a marsh wetland and introduces students to two native sedges found in marshes: makaloa (Cyperus laevigatus) and kohekohe (Eleocharis obtusa). Most children and adults that visit HNC have never heard of or seen either of these plants before. Environmental Educators may discuss the cultural value of these plants: Fibers from the makaloa can be used for weaving/plaiting very fine and soft mats, and some varieties of kohekohe were once used in offerings at fishponds. Makaloa is a prized resource for Hawaiian weavers, and although makaloa from the Green Machine has never been harvested for weaving, the potential for use remains a possibility in the future.
- Frequently, the Green Machine is used as a teaching tool in conjunction with Lo‘i ‘O Moleka, which is comprised of two restored taro patches along the Nā Ala Hele state trail system in Makiki Valley. The lo‘i shows wise water usage in a traditional context while the Green Machine shows an innovative approach for water stewardship incorporating modern technology. Together, the lo‘i and Green Machine provide a holistic, placed-based model that integrates culture and science to teach values of water conservation and sustainability. Both cultural science (lo‘i) and modern/Western science (Green Machine) have an important role in solving contemporary environmental problems in Hawai‘i and worldwide.
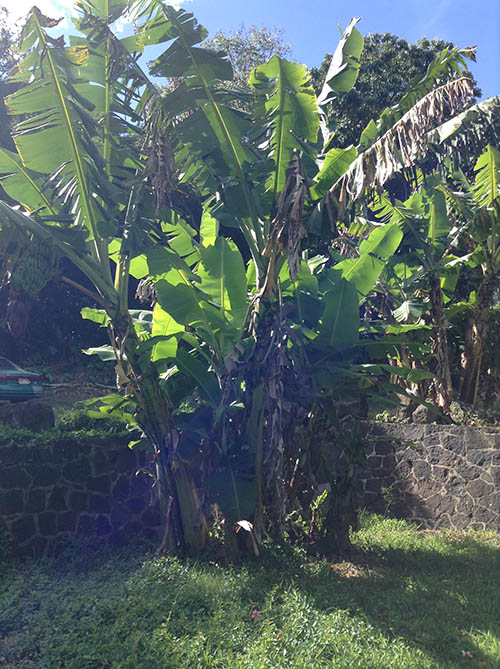
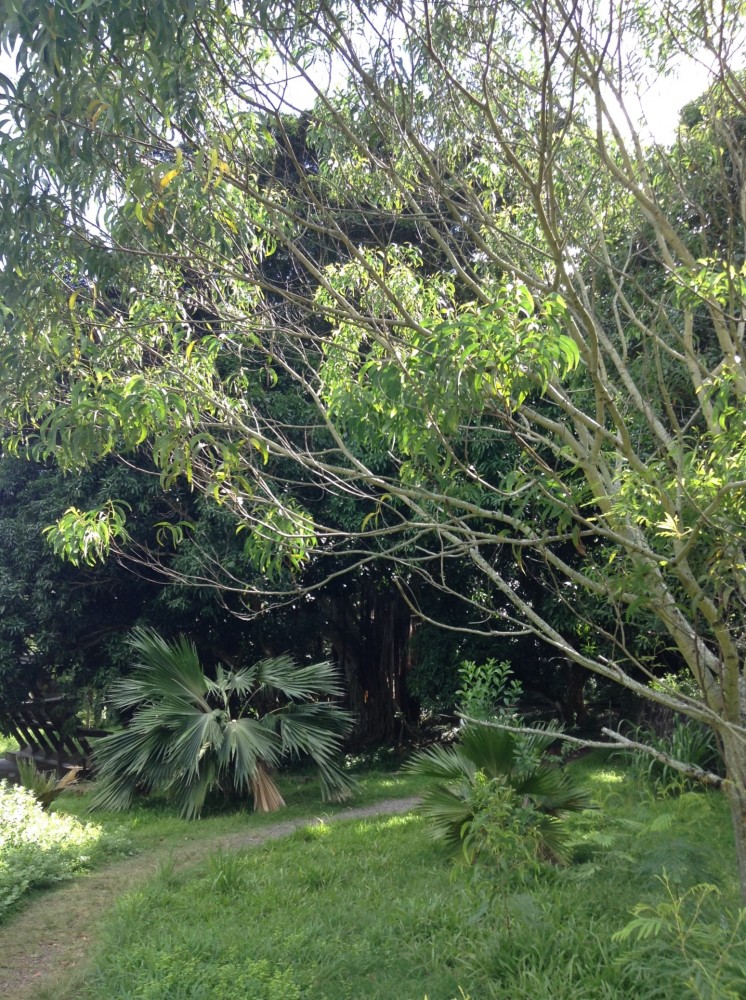
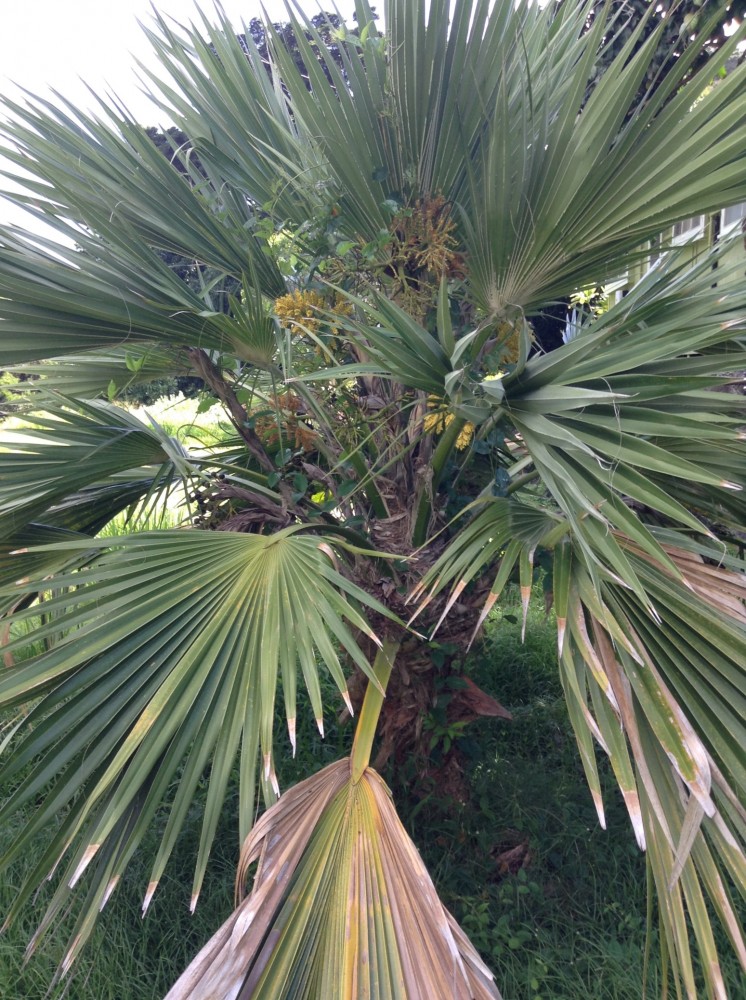
- An irrigation field where the effluent from the Green Machine flows has been cultivated with both native plants and canoe plants introduced by the Polynesians. Natives include pōhinahina (Vitex rotundifolia), loulu (Pritchardiaspp.), ‘ōhia lehua (Metrosideros polymorpha), koa (Acacia koa), and naio (Myoporum sandwicense). Canoe plants include mai‘a (Musa spp.), or banana, and ‘uala (Ipomoea batatas), or sweet potato. Plants are used for sensory learning (soft scented pōhinahina), nature activities (dried koa leaves for crafts), and lessons in native plants and animals (the “3 Ws”): salt-tolerant floating seeds of pōhinahina; light air-blown seeds of ‘ōhia lehua; and loulu seeds that could be eaten by honeycreepers. Bananas are harvested and shared during intersession day camps and support lessons in sustainable local agriculture. Sweet potatoes are not harvested for consumption but have been used in cultural educational lessons.
- The Green Machine most closely replicates a marsh wetland and introduces students to two native sedges found in marshes: makaloa (Cyperus laevigatus) and kohekohe (Eleocharis obtusa). Most children and adults that visit HNC have never heard of or seen either of these plants before. Environmental Educators may discuss the cultural value of these plants: Fibers from the makaloa can be used for weaving/plaiting very fine and soft mats, and some varieties of kohekohe were once used in offerings at fishponds. Makaloa is a prized resource for Hawaiian weavers, and although makaloa from the Green Machine has never been harvested for weaving, the potential for use remains a possibility in the future.
Educational Lessons
The Green Machine has become an essential component in teaching an array of environmental concepts across a range of ages. Some of these general lessons across all ages and programs include:
- Demonstrating environmental stewardship and sustainable practices.
- The Green Machine allows HNC to embody concepts of environmental stewardship that it teaches while providing a tangible example of a sustainable practice (i.e. water conservation/recycling). Children that visit HNC are encouraged to take care of our island resources and they can see HNC doing the same. The Green Machine is one of several ways HNC actively embodies stewardship that it promotes. In addition to the Green Machine, HNC has rooftop solar panels, rainwater catchment barrels, food gardens and native plant gardens, composting worms and compost piles, recycling bins, and aquaponics systems.
- Qualitative Analyses.
- Students are actively engaged when they visit the Green Machine by using their visual and olfactory senses to qualitatively assess the water treatment process. As students move along the treatment cells of the Green Machine, the strong odor decreases while water clarity and abundance of aquatic organisms (algae, fish, snails) increases. These changes are apparent to students young and old, and because they are typical indicators of water quality, students can apply this knowledge in other contexts.
- Visits to the Green Machine may be linked with activities at Makiki Stream to allow students to observe similarities and differences between the two. When time permits, water samples from both the stream and the Green Machine are collected and taken back to the HNC classroom to compare and contrast under stereo microscopes and compound microscopes.
- Water Conservation and Sustainability.
- The Green Machine exemplifies one strategy for water conservation and for taking care of finite island resources today with the future in mind. Groups are taken on a short tour that follows the “Path of the Pee” (Figure 1). The tour begins at the HNC bathrooms, moves to the wastewater holding tanks underneath the HNC lawn, proceeds to the Green Machine where the waste water treatment occurs, and finally to the irrigation field with native and Polynesian-introduced plants watered by the treated effluent. The short and interactive “Path of the Pee” tours are an important component in a variety of HNC programs, including overnight camps, intersession day camps, and custom programs with adults and/or international students.
- Wetland Services and Benefits.
- The Green Machine provides a unique opportunity for HNC educators to teach about wetland services and wetland ecology in Makiki Valley. As a self-contained constructed wetland, the Green Machine allows for a first-hand look at the many benefits one would observe by visiting a natural marsh wetland, including habitat and/or resources for plants and animals, removal and filtration of pollutants from water, and ecosystem interactions (gas exchange, nutrient processing, plant and algal growth rates, etc.).
The Green Machine is also a useful tool for teaching place-based cultural lessons and for teaching concepts of biomimicry.
- Lessons in Biomimicry with middle school students and intersession day camps.
- Biomimicry describes the emulation of nature’s systems, patterns, or designs to solve human challenges. This cutting edge, interdisciplinary field of science has become increasingly valuable for its applications in offering sustainable alternatives to practices that cause environmental degradation. The Green Machine highlights the sustainable aspect of biomimicry in its replication of a wetland marsh to naturally clean water so it can be reused. Ecological design, the principles upon which the Green Machine was constructed, can be considered a sub-category of biomimicry: whereas biomimicry copies features of natural systems or takes inspiration from them (without necessarily integrating the living components), ecological or biological design purposefully integrates natural living systems into the technology.
- Middle school students participating in HNC’s climate change program are introduced to biomimicry as a field of science that can offer solutions for mitigating the effects of climate change. Students are taken on the “Path of the Pee” tour and are encouraged to qualitatively assess the wastewater treatment process. Concepts of biomimicry are further elaborated upon and other examples of nature-inspired sustainable design are discussed, including architecture, clothing, and transportation. The lesson ends by engaging students in a hands-on biomimicry activity: building solar ovens with shoeboxes. Students are challenged to integrate aspects of biomimicry (specifically nature’s lessons in insulation and heat absorption) in their designs; to achieve this goal, they are given a variety of materials to creatively reuse (bubble wrap, newspaper, single-use plastic containers, etc.). Lessons and activities in biomimicry are similar for intersession day camps, but concepts are simplified for this younger group of children, ages 6-11.
- Cultural Education with intersession day camps and overnight camps students.
- The Green Machine most closely replicates a marsh wetland and introduces students to two native sedges found in marshes: makaloa (Cyperus laevigatus) and kohekohe (Eleocharis obtusa). Most children and adults that visit HNC have never heard of or seen either of these plants before. Environmental Educators may discuss the cultural value of these plants: Fibers from the makaloa can be used for weaving/plaiting very fine and soft mats, and some varieties of kohekohe were once used in offerings at fishponds. Makaloa is a prized resource for Hawaiian weavers, and although makaloa from the Green Machine has never been harvested for weaving, the potential for use remains a possibility in the future.
- Frequently, the Green Machine is used as a teaching tool in conjunction with Lo‘i ‘O Moleka, which is comprised of two restored taro patches along the Nā Ala Hele state trail system in Makiki Valley. The lo‘i shows wise water usage in a traditional context while the Green Machine shows an innovative approach for water stewardship incorporating modern technology. Together, the lo‘i and Green Machine provide a holistic, placed-based model that integrates culture and science to teach values of water conservation and sustainability. Both cultural science (lo‘i) and modern/Western science (Green Machine) have an important role in solving contemporary environmental problems in Hawai‘i and worldwide.
- An irrigation field where the effluent from the Green Machine flows has been cultivated with both native plants and canoe plants introduced by the Polynesians. Natives include pōhinahina (Vitex rotundifolia), loulu (Pritchardiaspp.), ‘ōhia lehua (Metrosideros polymorpha), koa (Acacia koa), and naio (Myoporum sandwicense). Canoe plants include mai‘a (Musa spp.), or banana, and ‘uala (Ipomoea batatas), or sweet potato. Plants are used for sensory learning (soft scented pōhinahina), nature activities (dried koa leaves for crafts), and lessons in native plants and animals (the “3 Ws”): salt-tolerant floating seeds of pōhinahina; light air-blown seeds of ‘ōhia lehua; and loulu seeds that could be eaten by honeycreepers. Bananas are harvested and shared during intersession day camps and support lessons in sustainable local agriculture. Sweet potatoes are not harvested for consumption but have been used in cultural educational lessons.
- The Green Machine most closely replicates a marsh wetland and introduces students to two native sedges found in marshes: makaloa (Cyperus laevigatus) and kohekohe (Eleocharis obtusa). Most children and adults that visit HNC have never heard of or seen either of these plants before. Environmental Educators may discuss the cultural value of these plants: Fibers from the makaloa can be used for weaving/plaiting very fine and soft mats, and some varieties of kohekohe were once used in offerings at fishponds. Makaloa is a prized resource for Hawaiian weavers, and although makaloa from the Green Machine has never been harvested for weaving, the potential for use remains a possibility in the future.
Acknowledgements:
HNC Education Team…Taylor Fujimoto, Kelli Morgan, Davis Holt, Kalei Rodrigues, Katharine Madjid, Michele Harman, Keoni Verity, Jana Phipps, Kara Rockstad
Key Players and Supporters…Cory Yap, Lauren Roth, Chad Durkin, Jamie Nakama, Pauline Kawamata Savannah Allshouse, Jeeyun Lee, Red Briou, Ty Tynan
References:
Akpan N. Wetlands Stopped $625 million in property damage during Hurricane Sandy. Can they help Houston? Public Broadcasting Station; 31 August 2017. [accessed 10 July 2018]. https://www.pbs.org/newshour/science/wetlands-stopped-650-million-property-damage-hurricane-sandy-can-help-houston
City and County of Honolulu Sewer Fund. Honolulu (HI): Office of the City Auditor, City and County of Honolulu; 30 June 2017 [accessed 10 July 2018]. http://www.honolulu.gov/rep/site/bfs/bfs_docs/CCH_-_Sewer_Fund_2017_FS_Final.pdf
Climate Change Adaptation and Saltwater Intrusion. US Environmental Protection Agency. [updated 29 September 2016; accessed 10 July 2018]. https://www.epa.gov/arc-x/climate-adaptation-and-saltwater-intrusion
Comprehensive Annual Financial Report. Honolulu (HI): City and County of Honolulu; 30 June 2017. [accessed 10 July 2018]. http://www.honolulu.gov/rep/site/bfs/bfs_docs/CC_Honolulu_CAFR_FY2017.pdf
Garza, JA; Chu P, Norton CW, Schroeder TA. Changes of the prevailing trade winds over the islands of Hawaii and the North Pacific. Journal of Geophysical Research. 2012; 117(D11109): 1-18. [accessed 10 July 2018]. http://www.soest.hawaii.edu/MET/Hsco/Trade%20wind%20changes%20JGR%202012.pdf
Guidelines for the Treatment and Use of Recycled Wastewater. Honolulu (HI): Hawaii State Department of Health, Wastewater Branch; 15 May 2002 [accessed 10 July 2018]. http://health.hawaii.gov/wastewater/files/2013/06/reuse-final.pdf
Harmon A. You Don’t Know Shit. Flux Magazine. 8 June 2015. [accessed 10 July 2018]. https://fluxhawaii.com/you-dont-know-shit/
How much water is there on, in, and above the Earth? US Geological Survey, Department of the Interior. [updated 2 December 2016; accessed 10 July 2018]. https://water.usgs.gov/edu/earthhowmuch.html
Mālama ‘Ᾱina Foundation. History of the Hawaii Nature Center ‘Green Machine’. 2016.
O‘ahu’s Water History. Honolulu (HI): Board of Water Supply; 2018. [accessed 10 July 2018]. http://www.boardofwatersupply.com/about-us/oahus-water-history
Other Uses and Types of Water. Atlanta (GA): Center for Disease Control and Prevention. [updated 11 October 2016; accessed 10 July 2018]. https://www.cdc.gov/healthywater/other/index.html
Todd NJ, Todd J. From Eco-Cities to Living Machines: Principles of Ecological Design. Berkeley: North Atlantic Books; 1993.
US Geological Survey. Hawaii - Wetland Resources. National Water Summary – Wetland Resources, Water Supply Paper 2425; 1999. p. 167-172. [accessed 10 July 2018]. https://www.fws.gov/wetlands/data/Water-Summary-Reports/National-Water-Summary-Wetland-Resources-Hawaii.pdf
Venu LR. Ecological Design for Island Water Systems. In: Thinking Like An Island: Navigating a Sustainable Future in Hawaii. Chirico J, Farley G, editors. Honolulu: University of Hawai‘i Press; 2015. p. 125-142.
Wastewater Systems. Honolulu (HI): City and County of Honolulu Department of Environmental Services; c2018 [updated 7 September 2017; accessed 10 July 2018]. http://www.honolulu.gov/envwwm.html
Wetlands. Washington, DC: World Wildlife Federation; 2018 [accessed 20, July 2018]. https://www.worldwildlife.org/habitats/wetlands
Wetlands. Natural Resources Conservation Service, US Department of Agriculture; c2018 [accessed 20 July 2018]. https://www.nrcs.usda.gov/wps/portal/nrcs/main/national/water/wetlands/
