Evaluating the usefulness of citizen science fish surveys in Hawai‘i for assessing large-scale shifts in reef fish assemblages
Anna B. Mikkelsen (1) & Timothy B. Grabowski (2)

The problem:
1) Increased human population, fishing pressure, and anthropogenic stressors are changing reef habitats and fish assemblages, but documenting these changes can be difficult (Walsh et al. 2013)
2) Monitoring data often has spatial and temporal gaps, changing or unstandardized monitoring methodologies across agencies, and a focus on exploited species (Friedlander et al. 2018)
A potential solution:
1) Data collected by citizen scientists address many of these weaknesses, but may lack the precision and scientific rigor of monitoring data
2) Data collected by citizen scientists has been shown to be a useful tool to evaluate species richness, species assemblages, and fish-habitat interaction (Jeffrey 2004); but have not been used to evaluate long-term changes in assemblage structure
Our objective was to evaluate whether volunteer fish survey data collected by citizen scientists and data collected by trained biologists as part of long-term monitoring efforts showed similar patterns in how reef fish assemblages have changed through time
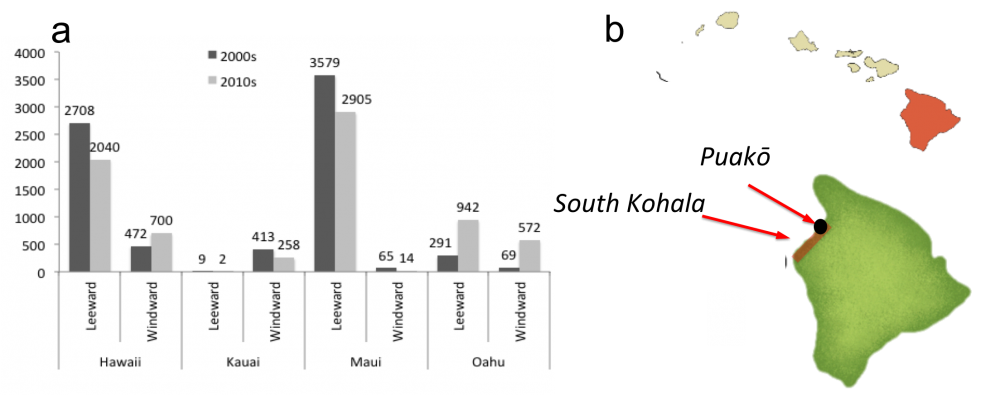 Fig 1. (a) Distribution of surveys conducted in Hawai‘i between 2000–2017 by REEF citizen scientists, categorized by Island, orientation: Windward or leeward, and period: 2000–2009 and 2010–2017. (b) The study site of Puakō where scientific surveys were conducted, and the South Kohala region that were compared to Puakō surveys
INTRODUCTION
The problem:
1) Increased human population, fishing pressure, and anthropogenic stressors are changing reef habitats and fish assemblages, but documenting these changes can be difficult (Walsh et al. 2013)
2) Monitoring data often has spatial and temporal gaps, changing or unstandardized monitoring methodologies across agencies, and a focus on exploited species (Friedlander et al. 2018)
A potential solution:
1) Data collected by citizen scientists address many of these weaknesses, but may lack the precision and scientific rigor of monitoring data
2) Data collected by citizen scientists has been shown to be a useful tool to evaluate species richness, species assemblages, and fish-habitat interaction (Jeffrey 2004); but have not been used to evaluate long-term changes in assemblage structure
Our objective was to evaluate whether volunteer fish survey data collected by citizen scientists and data collected by trained biologists as part of long-term monitoring efforts showed similar patterns in how reef fish assemblages have changed through time
Fig 1. (a) Distribution of surveys conducted in Hawai‘i between 2000–2017 by REEF citizen scientists, categorized by Island, orientation: Windward or leeward, and period: 2000–2009 and 2010–2017. (b) The study site of Puakō where scientific surveys were conducted, and the South Kohala region that were compared to Puakō surveys
Citizen Science data were extracted from Reef Environmental Education Foundation (REEF) database of fish surveys (n=517) collected by volunteer citizen scientists in the South Kohala region of Hawaii Island (Fig. 1)
– Roving diver surveys counting all fish species
– Categorical abundance assigned to all species sighted and positively identified, on the following abundance score:
0=0 individuals
1 = 1 individual
2=2-10 individuals
3=11-100 individuals
4=>100 individuals
Scientific data was collected at Puakō (Fig. 1) by the Hawaii Division of Aquatic Resources (1979-1981 and 2007-2008) and by UH Hilo scientific divers (2017-2018).
– 50m x 10m fish belt transects
– Direct enumeration of all sighted species in transect
Datasets were compared by comparing the direction of change from Pearson’s correlation analysis for each individual species
We compared the Pearson's correlation analysis of abundance through time between citizen science and scientific monitoring for each individual species. 123 species were observed in both datasets, see comparisons here
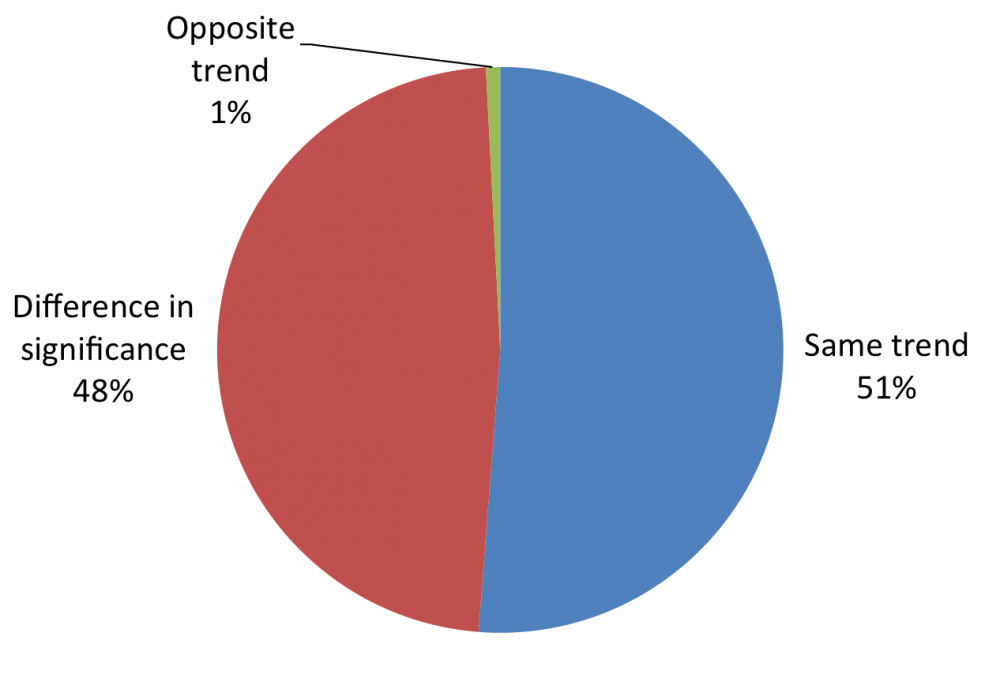
63 species (51%) exhibited the same trend (both increasing, decreasing or both not significant)
59 species (48%) had difference in statistical significance (one with a statistical correlation and one with no statistical correlation)
1 species (0.8%) had opposite trend (both significant but with opposite direction of change)
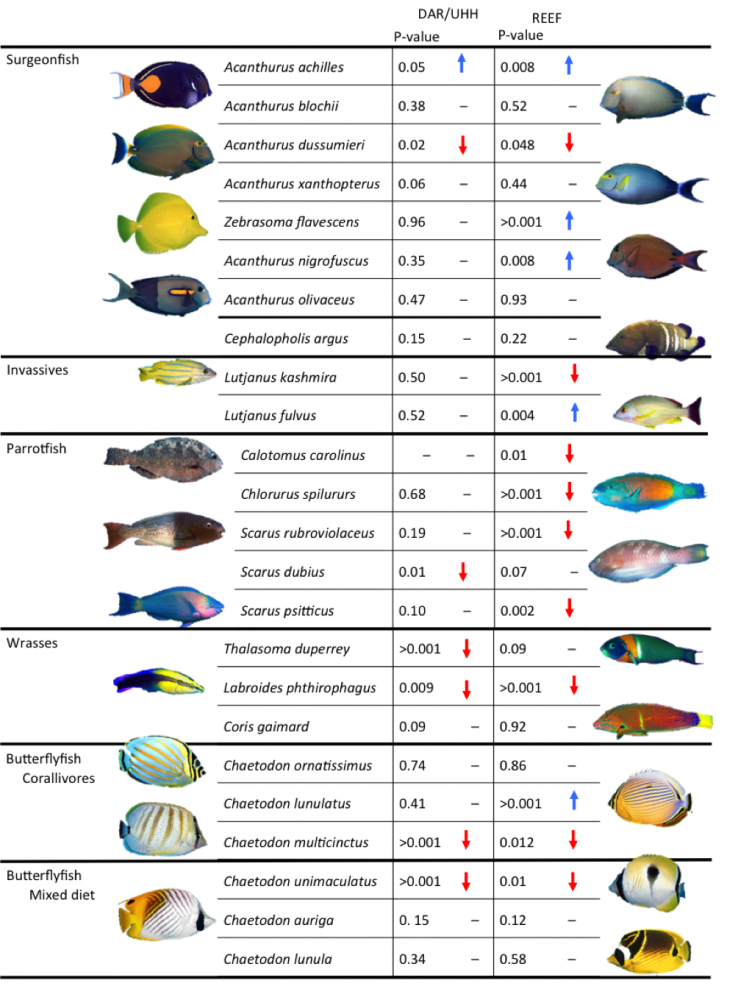
Figure 2 below illustrates the comparison of changes in fish abundances with scientific data collected by DAR/UHH in the left column, and citizen science data collected by REEF volunteers in the right column for selected reef fish. The p-value for a Pearson’s correlation test is given and if significant the direction of change marked by arrows.
RESULTS
We compared the Pearson's correlation analysis of abundance through time between citizen science and scientific monitoring for each individual species. 123 species were observed in both datasets, see comparisons here
63 species (51%) exhibited the same trend (both increasing, decreasing or both not significant)
59 species (48%) had difference in statistical significance (one with a statistical correlation and one with no statistical correlation)
1 species (0.8%) had opposite trend (both significant but with opposite direction of change)
Figure 2 below illustrates the comparison of changes in fish abundances with scientific data collected by DAR/UHH in the left column, and citizen science data collected by REEF volunteers in the right column for selected reef fish. The p-value for a Pearson’s correlation test is given and if significant the direction of change marked by arrows.
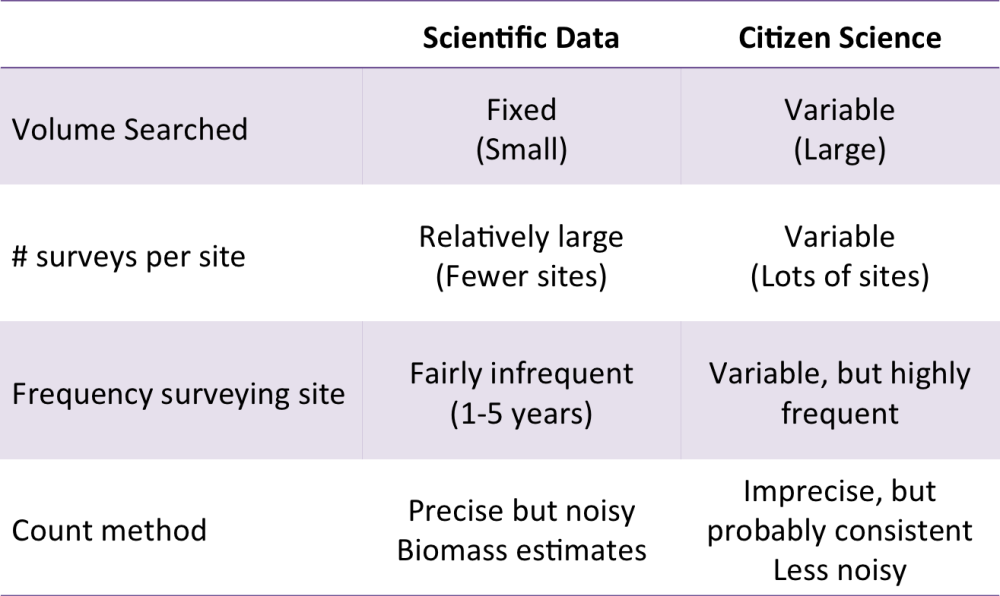
1) Different biases are associated with both survey methods (see fig 3 HERE). However despite differences there is some overall agreement between datasets
2) Scientific data detected less significance due to higher variability in single counts and lower sample size
3) The majority of “disagreements” are caused by differences in significance
Potential data limitations include the level of training of the surveyor, large abundance bins that may mask small changes, and limited habitat data availability.
DISCUSSION
1) Different biases are associated with both survey methods (see fig 3 HERE). However despite differences there is some overall agreement between datasets
2) Scientific data detected less significance due to higher variability in single counts and lower sample size
3) The majority of “disagreements” are caused by differences in significance
Potential data limitations include the level of training of the surveyor, large abundance bins that may mask small changes, and limited habitat data availability.
In conclusion we suggest citizen science can be used to examine large scale changes in fish assemblages in Hawai‘i, so long as the limitations of the data are considered
The overall trends found in the citizen science data agree with literature (Walsh et al. 2013, Friedlander et al. 2018)
We thank C. Semmens and the Reef Environmental Education Foundation (REEF) for contributing citizen science surveys to this project, and L. Kramer, M. Lamson, and W. Walsh, Division of Aquatic Resources, for providing the historic scientific data, comments and ideas. I also thank my field support K Lopes and M Byers; and M deMaintenon and K McDermid for help and guidance. Etta Karth, UH Hilo Marine Science Department for logistics and materials. Lastly, P Richardson for being a reliable REEF volunteer on the east side of Big Island and for encouraging words.
