Interactive feedbacks of climate, mineralogy and microbiological communities on soil carbon: A deep soil warming experiment
Casey McGrath*, B. Glazer**, M. Duvallet* , S. Crow*. *Department of Natural Resources and Environmental Management. **Department of Oceanography.

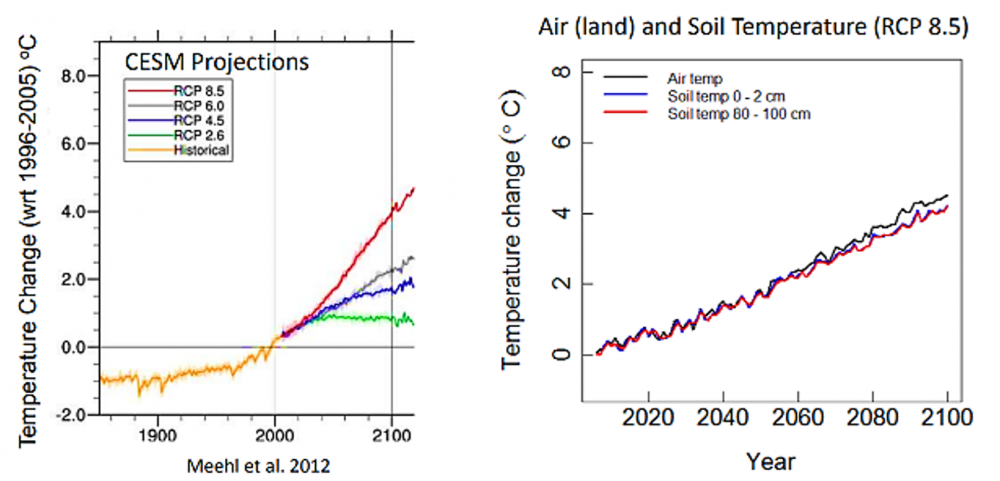
Figure 1: IPCC climate change projections until 2100 (left). The model predictions for global air and soil temperature (right).
Soils may reduce atmospheric greenhouse gas concentration
-Predicted average global temperature up 4 ˚C from ambient by 2100 (IPCC RCP 8.5 model) from increase in greenhouse gas concentrations
-Soils hold ⅔ of global terrestrial carbon (C) and have potential to sequester atmospheric C given that the mechanisms for stabilizing and storing carbon are not overwhelmed by the interactive effects of rapid warming on multiple soil processes.
-Volcanically-derived Andisols have high concentration of poorly and non-crystalline minerals with strong affinity to stabilize C, offering a unique study system to test hypotheses about mineral control on carbon stabilization and protection from disturbance losses.
Study Objectives
Heterogeneity of C flux on the landscape and technology required for real-time monitoring of soil temperature were two challenges addressed prior to implementation of a quantitative manipulative deep soil warming experiment:
1. Establish the carbon flux heterogeneity of the field site to understand the best homogenized locations for probes
2.Characterize the soil "deep soil" cores (50 sampling locations up to 1m) for C, N, Fe, Al
3.Develop the novel temperature sensor network for collecting data and heating probes for future soil warming project
1. Study Background
Figure 1: IPCC climate change projections until 2100 (left). The model predictions for global air and soil temperature (right).
Soils may reduce atmospheric greenhouse gas concentration
-Predicted average global temperature up 4 ˚C from ambient by 2100 (IPCC RCP 8.5 model) from increase in greenhouse gas concentrations
-Soils hold ⅔ of global terrestrial carbon (C) and have potential to sequester atmospheric C given that the mechanisms for stabilizing and storing carbon are not overwhelmed by the interactive effects of rapid warming on multiple soil processes.
-Volcanically-derived Andisols have high concentration of poorly and non-crystalline minerals with strong affinity to stabilize C, offering a unique study system to test hypotheses about mineral control on carbon stabilization and protection from disturbance losses.
Study Objectives
Heterogeneity of C flux on the landscape and technology required for real-time monitoring of soil temperature were two challenges addressed prior to implementation of a quantitative manipulative deep soil warming experiment:
1. Establish the carbon flux heterogeneity of the field site to understand the best homogenized locations for probes
2.Characterize the soil "deep soil" cores (50 sampling locations up to 1m) for C, N, Fe, Al
3.Develop the novel temperature sensor network for collecting data and heating probes for future soil warming project
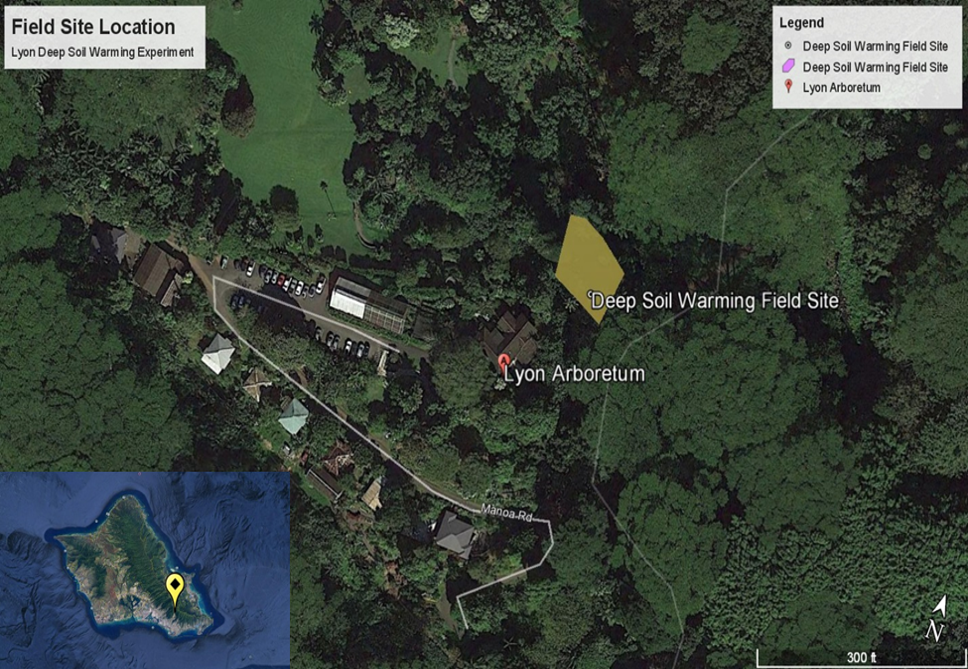 Figure 2: Map of field site location
The field site is at the Lyon Arboretum in Manoa Valley and was chosen for its accessibility and andic soils. The site receives 4190 mm of precipitation annually and has a mean annual temperature of 25.6° C
Blog post on establishing the site:
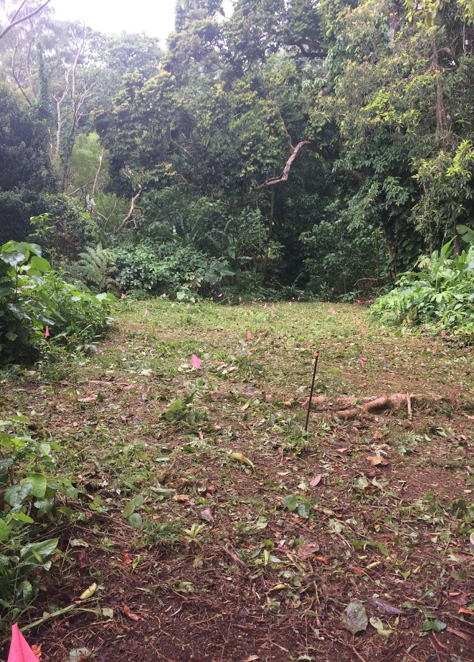
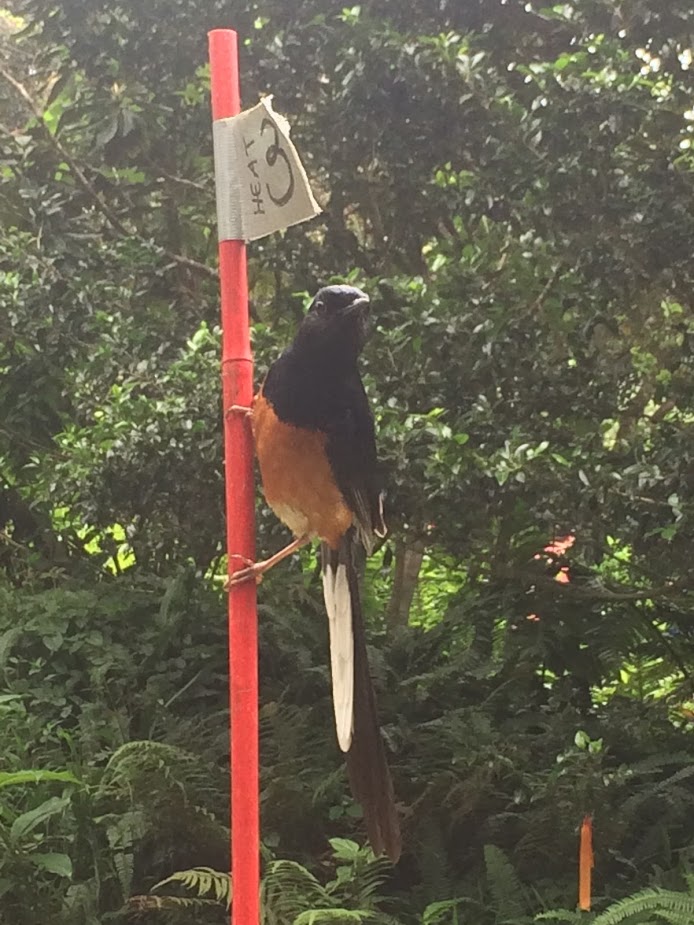
Figure 3: Field site Spring 2018
2. Field Site
Figure 2: Map of field site location
The field site is at the Lyon Arboretum in Manoa Valley and was chosen for its accessibility and andic soils. The site receives 4190 mm of precipitation annually and has a mean annual temperature of 25.6° C
Blog post on establishing the site:
Figure 3: Field site Spring 2018
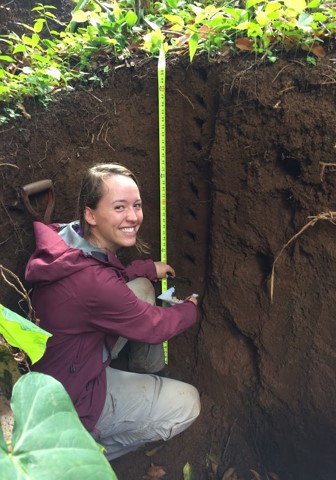
Figure 4: Collecting soil cores from the 130cm pit
Video on sampling a 1m soil core:
Blog post on soil pit sampling at Lyon:
https://caseymcgrath95.wixsite.com/lyonsoilwarming/single-post/2017/11/17/Soil-Pit-Sampling
Soil samples were taken November '17 every 10cm from a 130cm deep pit at the bottom of the hillslope
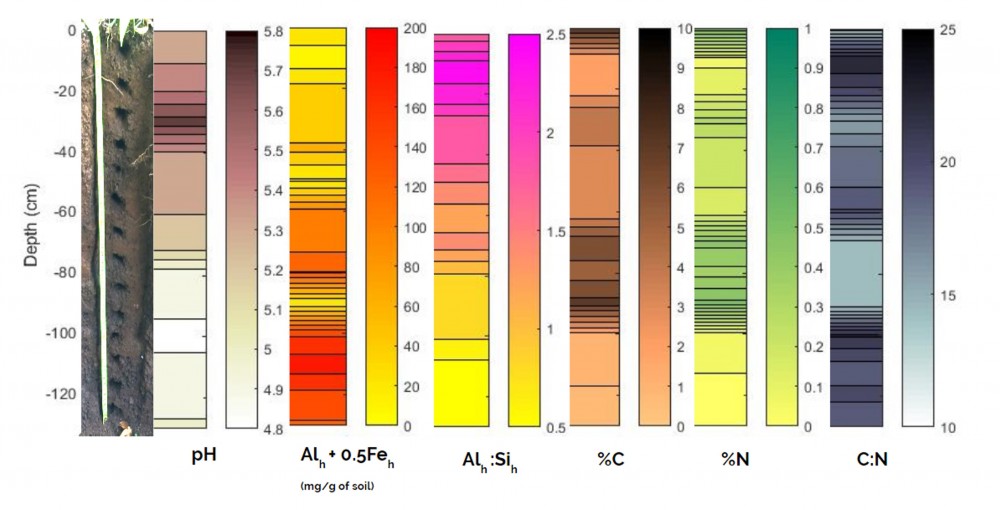 Figure 5: Soil pit characteriation sampled every 10cm from the soil surface to 130cm for pH, Alh+ 0.5Feh (non crystalline minerals), Al:Si, %C, %N and C:N
Main findings of 130cm soil pit characterization
-pH is more acidic as you go deeper into the soil profile
-Carbon (C) highest at the top and middle of the soil profile: 0-10cm and 60-100cm
-C:N ratio (for assessing decomposition rates) highest at top and bottom: 10-20cm and 100-130cm
-The non-crystalline mineral abundance (reported as hydroxylamine hydrochloride hydrochloric acid extractable Alh + ½ Feh) is highest in deep soil: 100-130cm
3. Soil Characterization
Figure 4: Collecting soil cores from the 130cm pit
Video on sampling a 1m soil core:
Blog post on soil pit sampling at Lyon:
https://caseymcgrath95.wixsite.com/lyonsoilwarming/single-post/2017/11/17/Soil-Pit-Sampling
Soil samples were taken November '17 every 10cm from a 130cm deep pit at the bottom of the hillslope
Figure 5: Soil pit characteriation sampled every 10cm from the soil surface to 130cm for pH, Alh+ 0.5Feh (non crystalline minerals), Al:Si, %C, %N and C:N
Main findings of 130cm soil pit characterization
-pH is more acidic as you go deeper into the soil profile
-Carbon (C) highest at the top and middle of the soil profile: 0-10cm and 60-100cm
-C:N ratio (for assessing decomposition rates) highest at top and bottom: 10-20cm and 100-130cm
-The non-crystalline mineral abundance (reported as hydroxylamine hydrochloride hydrochloric acid extractable Alh + ½ Feh) is highest in deep soil: 100-130cm
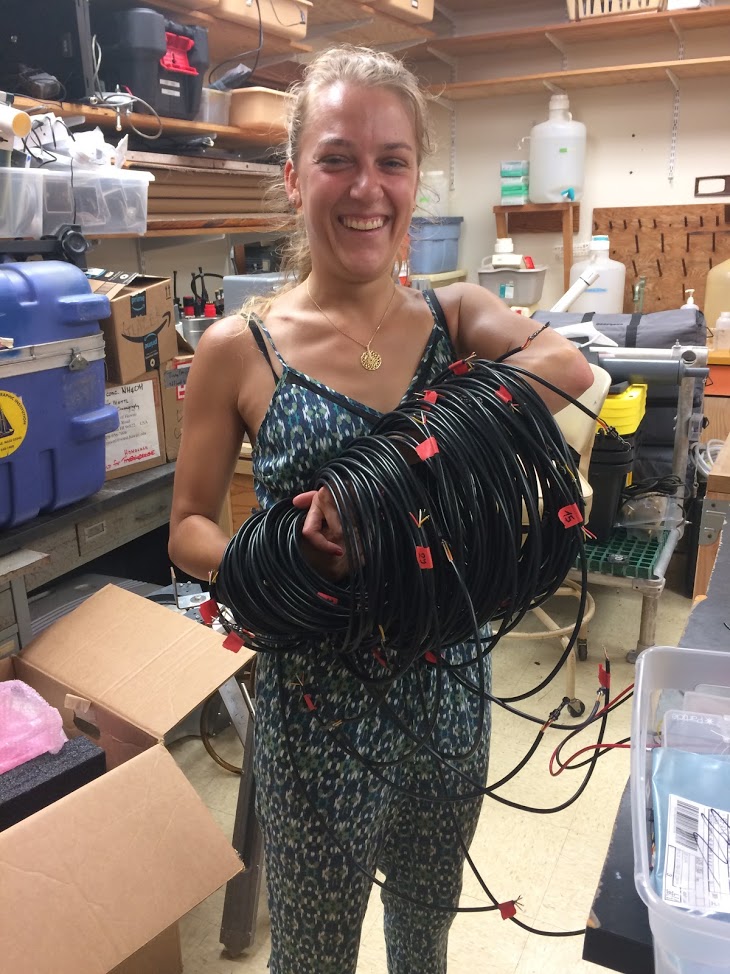 Figure 9: Mathilide, project intern, holding the 50 completed sensors after conductance and waterproofing tests
Blog post on temperature sensor creation:
https://caseymcgrath95.wixsite.com/lyonsoilwarming/single-post/2018/05/18/Temperature-Probe-Creation
Ensuring Proper Sensor Conductance
-Tested conductance of stainless steel temperature probe as means for waterproof housing of environmentally vulnerable temperature sensors
-Steel probe subject to water bath test with three external sensors measuring temperature at top, middle and bottom and internal bottom (Figure 9)
-Steel probe conductance was concluded as poor (1 ˚C between external and internal)
-Develop new method of waterproofing sensors themselves for deployment
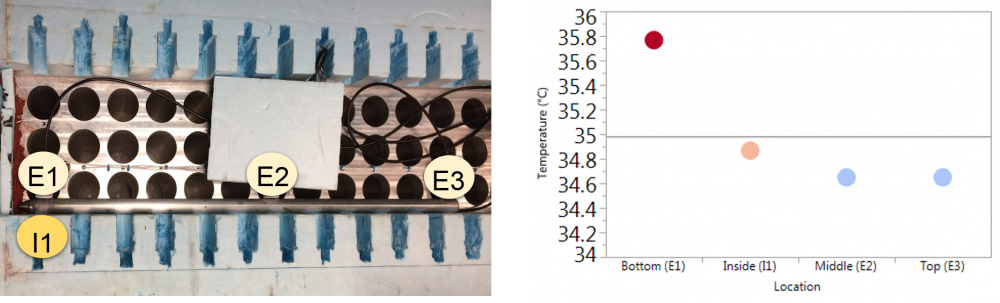 Figure 10: Conductance test setup. E1-3 are external sensors, I1 is the internal sensor (left). Four different stabilized sensor readings after week long conductance test (right).
Ensuring Sensor Waterproofing
-Two waterproofing designs: “insurance” and “efficient”
-Placed in saltwater bath for three weeks to establish any leaks in model design
-Both sensors behaves similarly reporting within 0.1˚C of each other
-“Efficient” model was chosen for simple yet effective design
-Saltwater bath test will act as protocol for waterproofing testing all sensors
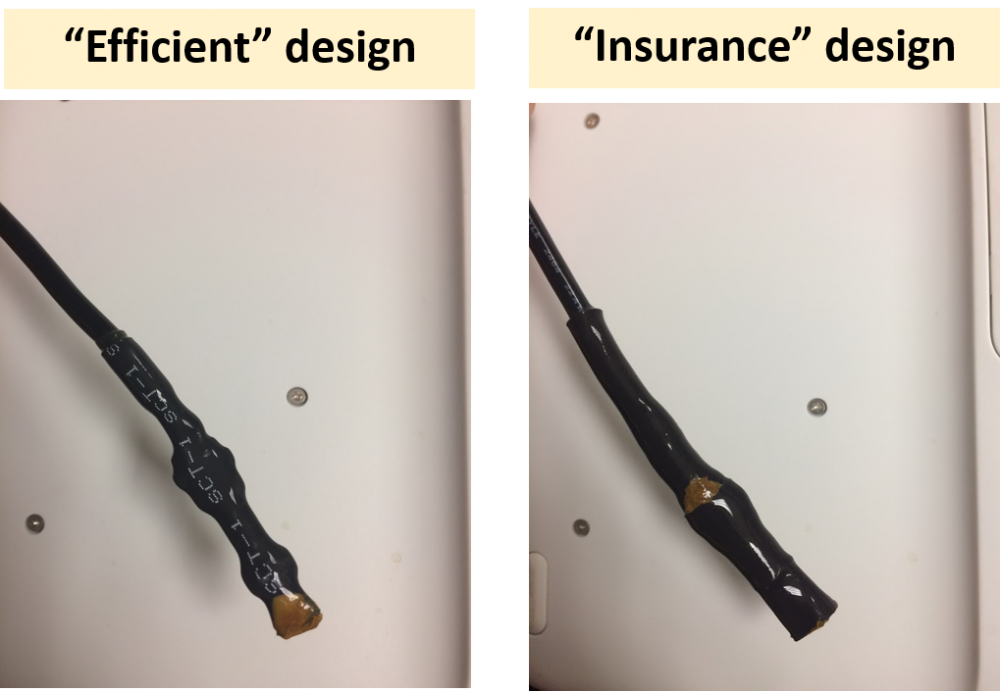 Figure 11: The two waterproofing designs for the temperature sensors
Blog post on temperature sensor waterproofing:
https://caseymcgrath95.wixsite.com/lyonsoilwarming/single-post/2018/05/17/Submerging-the-sensors
5. Novel Sensor Network
Figure 9: Mathilide, project intern, holding the 50 completed sensors after conductance and waterproofing tests
Blog post on temperature sensor creation:
https://caseymcgrath95.wixsite.com/lyonsoilwarming/single-post/2018/05/18/Temperature-Probe-Creation
Ensuring Proper Sensor Conductance
-Tested conductance of stainless steel temperature probe as means for waterproof housing of environmentally vulnerable temperature sensors
-Steel probe subject to water bath test with three external sensors measuring temperature at top, middle and bottom and internal bottom (Figure 9)
-Steel probe conductance was concluded as poor (1 ˚C between external and internal)
-Develop new method of waterproofing sensors themselves for deployment
Figure 10: Conductance test setup. E1-3 are external sensors, I1 is the internal sensor (left). Four different stabilized sensor readings after week long conductance test (right).
Ensuring Sensor Waterproofing
-Two waterproofing designs: “insurance” and “efficient”
-Placed in saltwater bath for three weeks to establish any leaks in model design
-Both sensors behaves similarly reporting within 0.1˚C of each other
-“Efficient” model was chosen for simple yet effective design
-Saltwater bath test will act as protocol for waterproofing testing all sensors
Figure 11: The two waterproofing designs for the temperature sensors
Blog post on temperature sensor waterproofing:
https://caseymcgrath95.wixsite.com/lyonsoilwarming/single-post/2018/05/17/Submerging-the-sensors
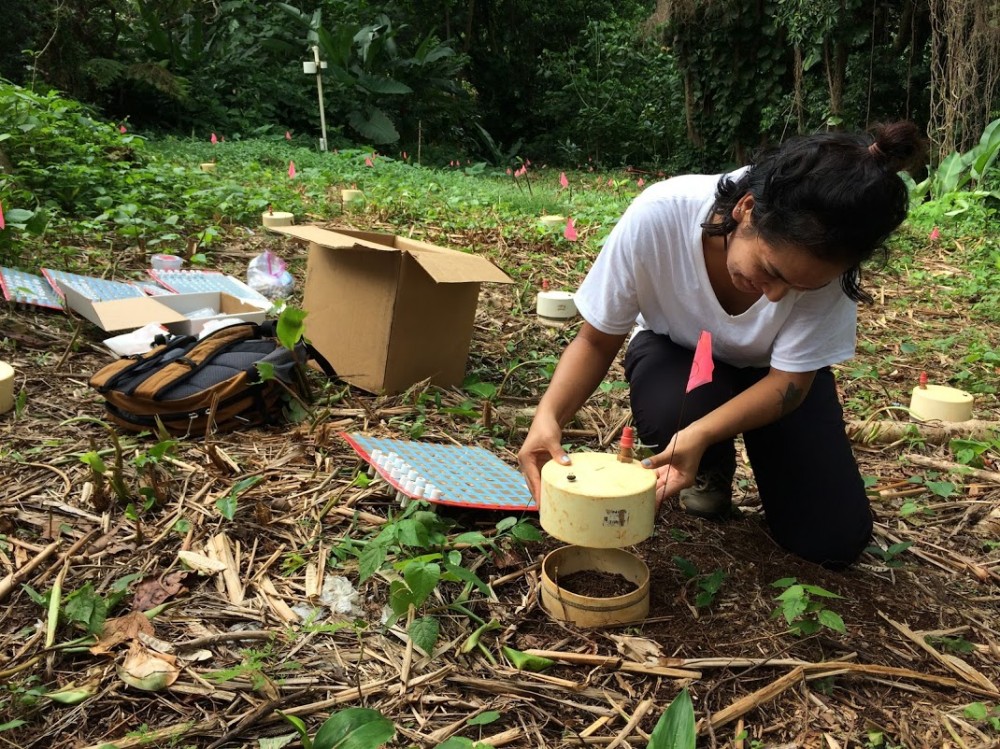 Figure 6: Static chamber units for sampling for the CO2 flux
Blog post on establishing collar network:
Blog post on sampling from collar network using USDA GRACEnet protocol:
https://caseymcgrath95.wixsite.com/lyonsoilwarming/single-post/2017/09/30/First-Sampling-Result
CO2 from soil respiration of microbes is measured biweekly using static chamber units:
-Sept ’17 to Sept ’18, sampled at 5 timepoints (every 15min for 1hr), concentration determined using gas chromatography to establish soil respiration seasonality
-Averaged flux derived from biweekly total flux maps to find existing hotspots to establish areas of homogeneity for sampling (Figure 6)
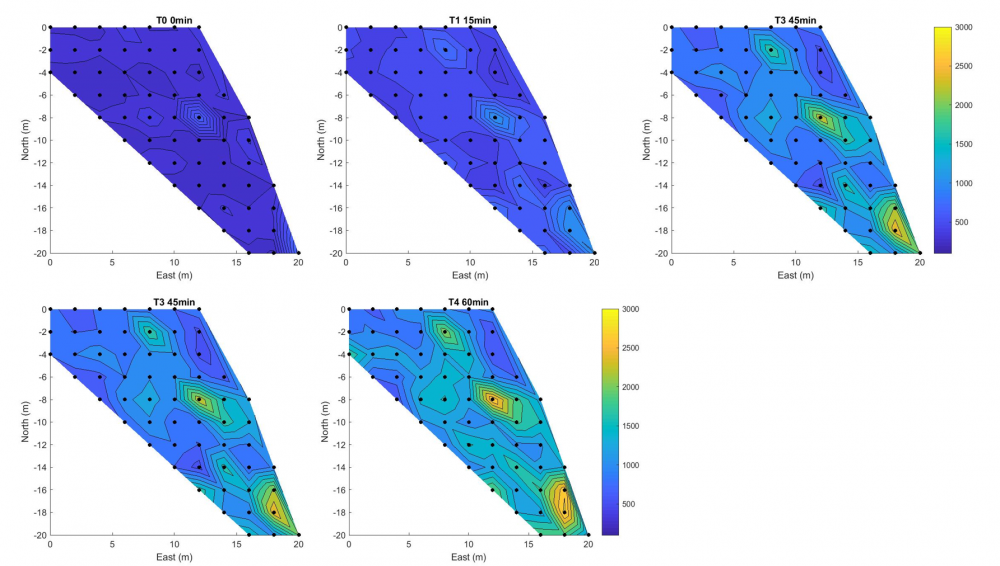
Figure 7: CO2 flux is determined by measuring how CO2 concentrations increase over time in a static chamber network throughout the hillslope.
Stratified random sample design was utilized to get a totally randomized design with a wide ranging gradient in soil depth and temperature data, for later use in multivariate statistics:
-‘hotspot’ flux sites not included
-Avoid heating around ʻōhiʻa area
-Stratified site into 5 like plots from all potential grid cells (white)
-Randomly assign 1 heating probe and 10 temp/gas probes to each plot using atmospheric noise to randomize.
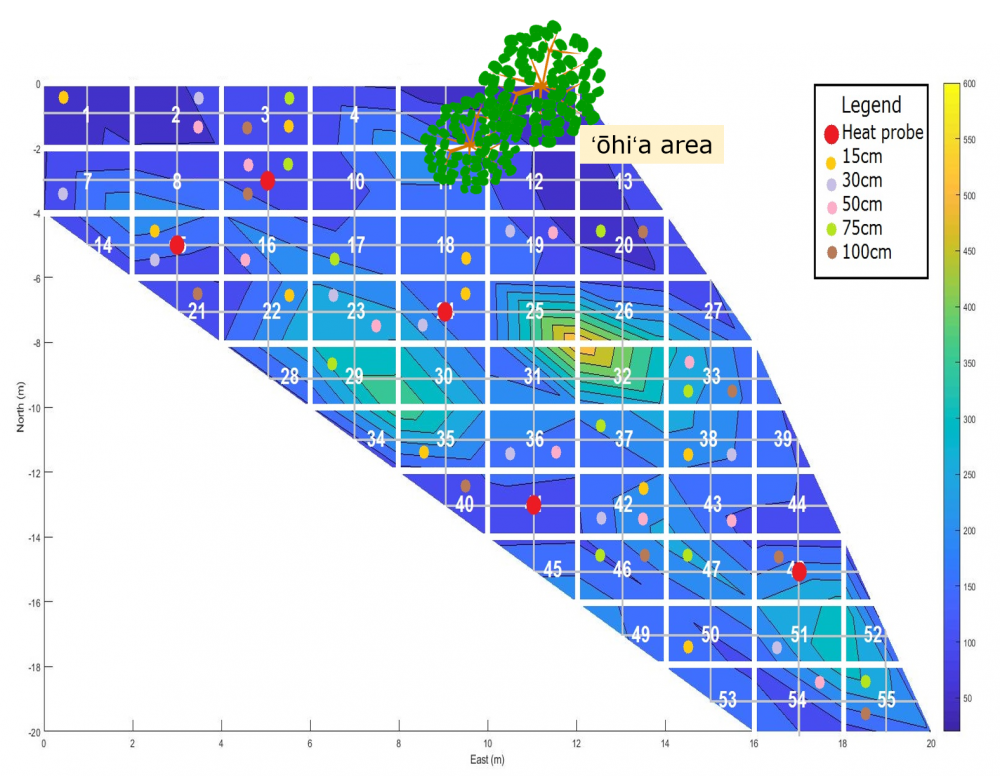 Figure 8: Proposed randomized design for larger deep soil warming experiment using total flux map from September ‘17 to March ’18. See legend for probe locations
4. Carbon Flux Heterogeneity
Figure 6: Static chamber units for sampling for the CO2 flux
Blog post on establishing collar network:
Blog post on sampling from collar network using USDA GRACEnet protocol:
https://caseymcgrath95.wixsite.com/lyonsoilwarming/single-post/2017/09/30/First-Sampling-Result
CO2 from soil respiration of microbes is measured biweekly using static chamber units:
-Sept ’17 to Sept ’18, sampled at 5 timepoints (every 15min for 1hr), concentration determined using gas chromatography to establish soil respiration seasonality
-Averaged flux derived from biweekly total flux maps to find existing hotspots to establish areas of homogeneity for sampling (Figure 6)
Figure 7: CO2 flux is determined by measuring how CO2 concentrations increase over time in a static chamber network throughout the hillslope.
Stratified random sample design was utilized to get a totally randomized design with a wide ranging gradient in soil depth and temperature data, for later use in multivariate statistics:
-‘hotspot’ flux sites not included
-Avoid heating around ʻōhiʻa area
-Stratified site into 5 like plots from all potential grid cells (white)
-Randomly assign 1 heating probe and 10 temp/gas probes to each plot using atmospheric noise to randomize.
Figure 8: Proposed randomized design for larger deep soil warming experiment using total flux map from September ‘17 to March ’18. See legend for probe locations
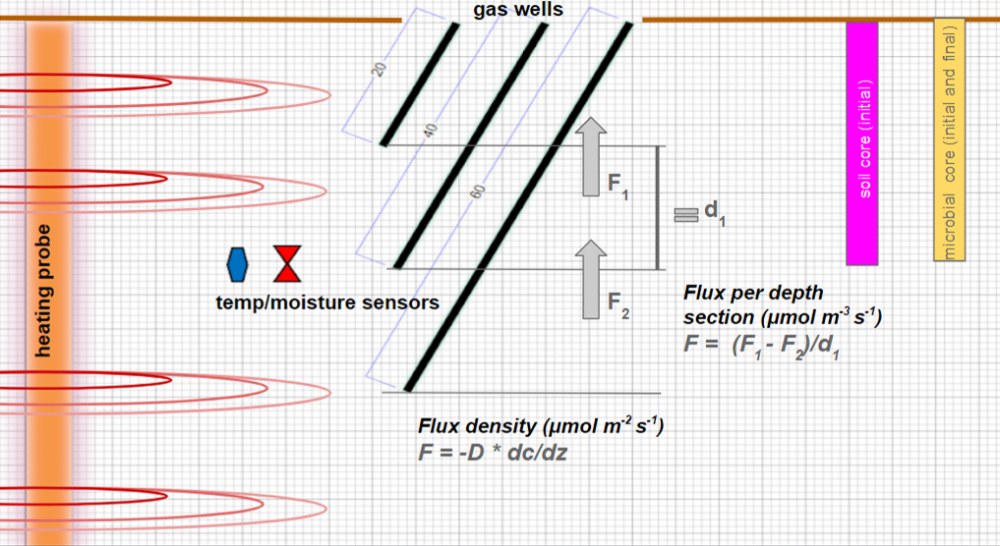
Figure 12: The experimental design of the gas wells, soil and microbial sampling, temperature and soil mositure sesnors and heating probe within the soil profile
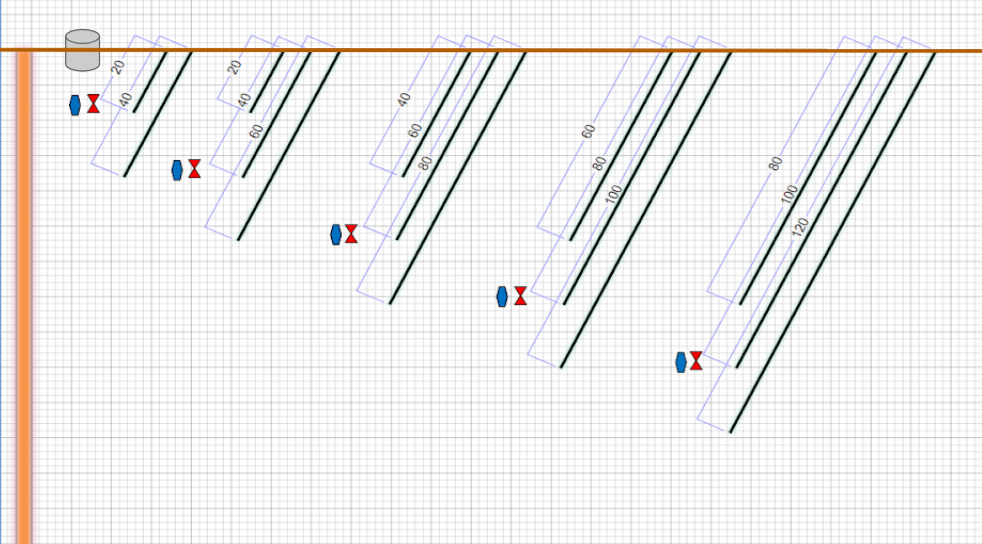
Figure 13: The different sets of depths of gas wells that are randomized across the hill slope of the field site.
Understanding how soil respiration changes with depth requires gas wells installed into the soil at a 45 degree angle to eliminate any preferential flow paths. Gas wells were installed to measure soil respiration at 20, 40, 60, 80, 100 and 120cm. The flux is estimated between layers shown in Figure 12.
This flux will then be compared with the gradient of heating shown by the temperature sensor network created by the distance from the heating probes. This flux at each location over time will then be used in data analysis with the C, N, Fe, Al, pH and microbial communities to understand how soil respiration changes with heating in a volcanic ash derived soil.
6. Deep Soil Flux
Figure 12: The experimental design of the gas wells, soil and microbial sampling, temperature and soil mositure sesnors and heating probe within the soil profile
Figure 13: The different sets of depths of gas wells that are randomized across the hill slope of the field site.
Understanding how soil respiration changes with depth requires gas wells installed into the soil at a 45 degree angle to eliminate any preferential flow paths. Gas wells were installed to measure soil respiration at 20, 40, 60, 80, 100 and 120cm. The flux is estimated between layers shown in Figure 12.
This flux will then be compared with the gradient of heating shown by the temperature sensor network created by the distance from the heating probes. This flux at each location over time will then be used in data analysis with the C, N, Fe, Al, pH and microbial communities to understand how soil respiration changes with heating in a volcanic ash derived soil.
Network Installation
-Soil heating probes, gas wells and temperature sensors will be installed in late Spring ‘18 and experimental system starts heating in early Summer ‘18
Soil Cores and Heating
-Soil cores taken for mineral and microbial biodiversity characterization (before heating) and heating will continue for entire year
Data Collection
-Soil respiration data collection from static chamber network and gas wells will happen from Summer ‘18 to Fall ‘18, until “threshold of warming” has been reached (slope from overall study period of CO2 flux from soil levels off)
-Second core taken for microbial biodiversity analysis (after heating)
Data Analysis
-Data analysis using multivariate community ecology statistics late Fall ‘18 to Spring ’19
-Expect the higher non-crystalline mineral soil at depth will stabilize C, thus lower deep soil respiration rates and also that microbial biodiversity will decrease under warming
7. The Next Steps
Network Installation
-Soil heating probes, gas wells and temperature sensors will be installed in late Spring ‘18 and experimental system starts heating in early Summer ‘18
Soil Cores and Heating
-Soil cores taken for mineral and microbial biodiversity characterization (before heating) and heating will continue for entire year
Data Collection
-Soil respiration data collection from static chamber network and gas wells will happen from Summer ‘18 to Fall ‘18, until “threshold of warming” has been reached (slope from overall study period of CO2 flux from soil levels off)
-Second core taken for microbial biodiversity analysis (after heating)
Data Analysis
-Data analysis using multivariate community ecology statistics late Fall ‘18 to Spring ’19
-Expect the higher non-crystalline mineral soil at depth will stabilize C, thus lower deep soil respiration rates and also that microbial biodiversity will decrease under warming
